
Figures & data
Figure 1. Flow chart of study screening.
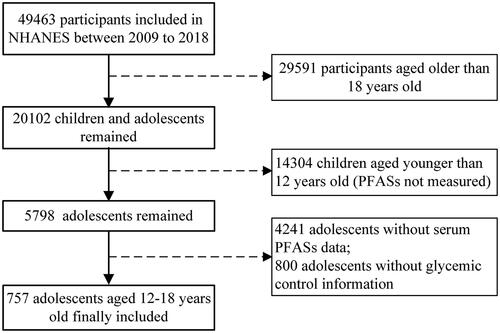
Table 1. Characteristics of adolescents in the NHANES, 2009–2018.
Figure 2. Pairwise correlation of five serum PFASs in adolescents. All correlations were statistically significant (p value < .001).
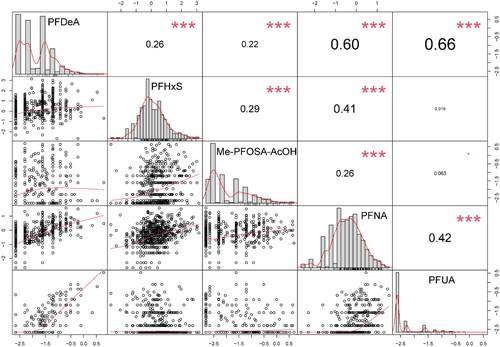
Table 2. Associations between each serum PFAS (ln-transformed) and the glycometabolism outcomes.
Table 3. Associations between the WQS regression index and glycometabolism in NHANES, 2009–2018.
Figure 3. The weight of each PFAS in the WQS model. The figure shows the weights of individual PFAS contributing to the overall effect. WQS model regression index weights for FBG: fasting blood glucose (A), INS: insulin (B), HOMA-IR: homeostasis model of assessment for insulin resistance index (C) and GHB: glycosylated haemoglobin (D).
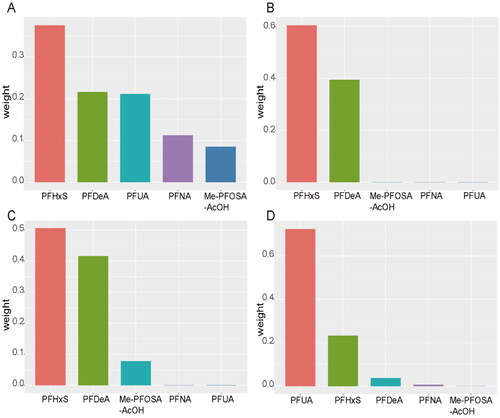
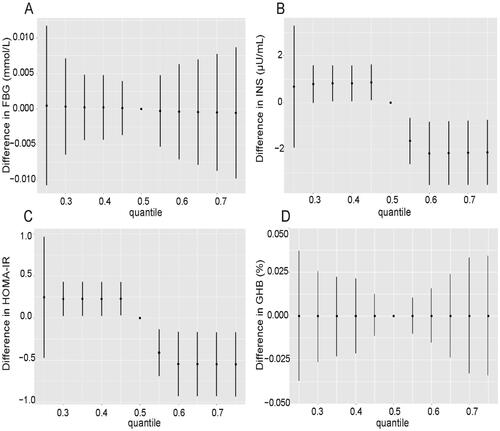
Figure 4. Combined effects of mixed PFAS exposure on FBG: fasting blood glucose (A), INS: insulin (B), HOMA-IR: homeostasis model of assessment for insulin resistance index (C) and GHB: glycosylated haemoglobin (D) levels in the BKMR model. The relationship between PFASs at other percentiles and outcomes of interest was shown in comparison to the situation where all PFASs were kept at median levels.
Supplemental Material
Download MS Word (2.5 MB)Data availability statement
The data that support the findings of this study are openly available in NHANES - National Health and Nutrition Examination Survey Homepage at https://www.cdc.gov/nchs/nhanes/.