
Figures & data
Figure 1. Flow chart of the study.
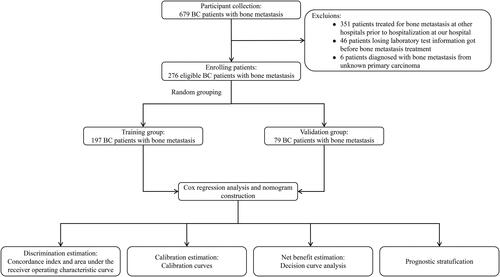
Table 1. Patient characteristics in the study.
Figure 2. Kaplan-Meier survival curve to show that the different levels of laboratory examination indicators had a significant impact on the OS of patients.
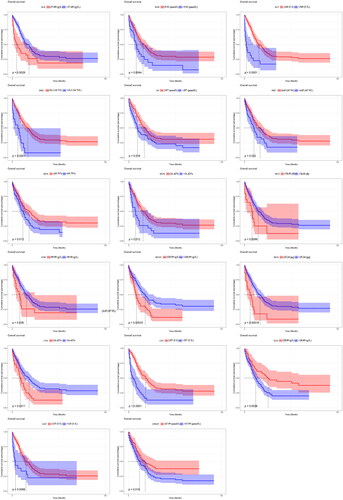
Table 2. Univariate and multivariate Cox regression analysis in breast cancer patients with bone metastases.
Figure 3. Nomogram for 1, 3, and 5-year OS prediction of the breast cancer patients with bone metastasis. Each prognostic factor was assigned a point on the scale, and the sum of the total points projected on the bottom scale represent the probabilities of 1, 3, and 5-year OS.
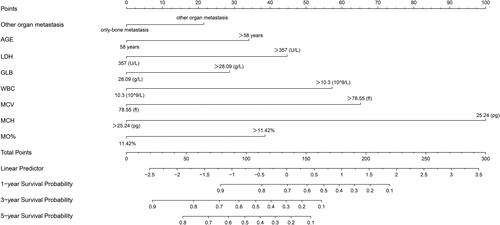
Figure 4. Receiver operating characteristic (ROC) curves of 1, 3, and 5-year in the training (A) and validation cohorts (B), respectively. The area under the ROC curve (AUC) was 0.797, 0.782, and 0.794 in the training cohort, and 0.723, 0.742, and 0.704 in the validation cohort, respectively.
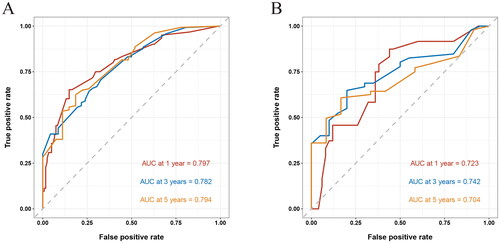
Figure 5. The calibration curves of the prognostic nomogram for the 1, 3, and 5-year OS prediction of the training (A–C) and validation group (D–F). the calibration curves suggested that the predictive outcome have good accordance with the actual 1, 3, and 5-year OS in both training and validation group.
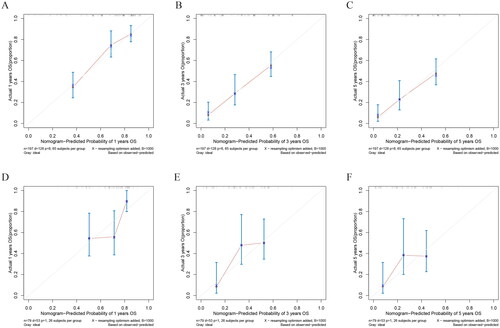
Figure 6. DCA of the nomogram for the survival prediction of breast cancer patients with bone metastasis in the training and validation groups. (A–C) 1, 3, and 5-year survival benefit in training cohort; (D-F) 1, 3, and 5-year survival benefit in validation cohort. The ‘ALL’, ‘none’ and ‘nomogram’ lines are represented as ‘intervention for all’ (blue dashed line), ‘intervention for none’ (green dashed line), and ‘result for the nomogram’ (red line). the ‘none’ and ‘ALL’ lines would show the expected net benefit without and with the intervention development respectively. DCA curves showed that nomogram manifested a higher net clinical benefit than ‘none’ and ‘all’.
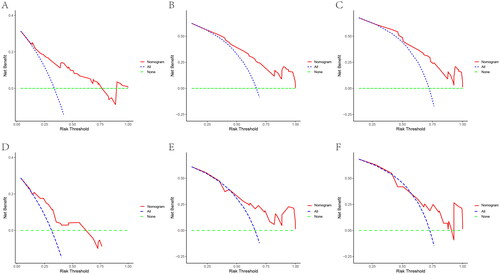
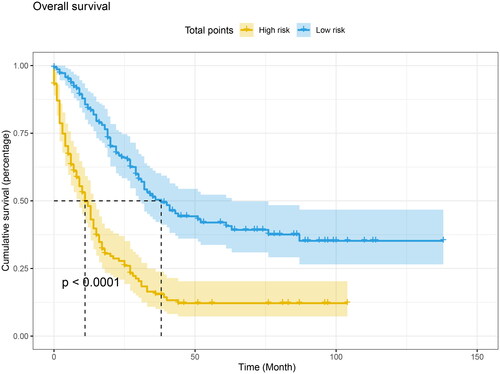
Figure 7. Kaplan-Meier curve of risk stratification for OS based on nomogram. The low-risk and high-risk meant normalized prognostic scores ≤ 1.93 and >1.93 for OS, respectively. Log-rank test was applied to estimate the significant difference.
Data availability statement
The raw data and the R codes supporting the conclusions of this article will be made available by the corresponding authors, without undue reservation.