
Figures & data
Table 1. Demographic and biochemical characteristics of patients grouped according to the SYNTAX score.
Figure 1. Multivariate logistic regression analysis of serum TBA and Lactobacillus on coronary lesions severity. (A) Heat map to show or and p value for the risk of a high SYNTAX score (the green and yellow blocks represent negative and positive correlations, respectively); (B) multivariate logistic regression model adjusted for age, left ventricular ejection fraction (LVEF), CK max, CK-MB max, cTNT max, C-reactive protein (CRP), serum total bile acids (TBA) and Lactobacillus between SYNTAX score medium group and low group (Ref.); (c) multivariate logistic regression model adjusted for age, left ventricular ejection fraction (LVEF), CK max, CK-MB max, cTNT max, C-reactive protein (CRP), scrum total bile acids (TBA) and Lactobacillus between SYNTAX score high group and low group (Ref.); *p value < .05; **p value < .01.
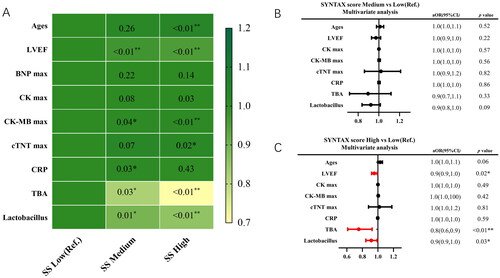
Figure 2. Subgroup analysis in different type of ACS (AMI and UAP). (A,B) Multivariate logistic regression analysis adjusting for ages, diabetes, LVEF, HDL, total bile acid (TBA) and Lactobacillus in AMI group; (C, D) multivariate logistic regression analysis adjusting for total bile acid (TBA) and Lactobacillus in UAP group.
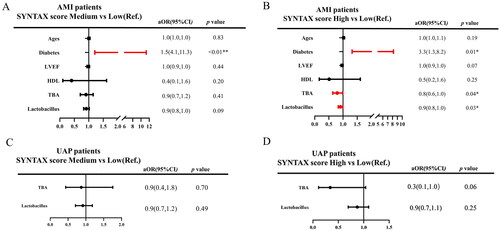
Figure 3. The correlation between serum total bile acid (TBA) and biomarkers. (A) The Kruskal–Wallis test of the relationship between TBA and biomarkers; (B) correlation analysis between TBA and biomarkers (the green and orange blocks represent negative and positive correlations, the numbers in each block represent the p value).
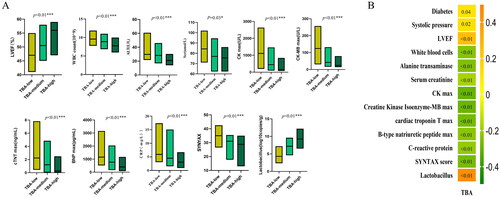
Table 2. Demographic and biochemical characteristics of patients grouped according to the all-cause death and cardiac-cause death.
Figure 4. Kaplan–Meier’s survival curve with all-cause death and cardiac death as endpoint events. (A) The Kaplan–Meier curve between serum TBA and all-cause death. (B) The Kaplan–Meier curve between serum TBA and cardiac death. (C) The Kaplan–Meier curve between Lactobacillus and all-cause death. (D) The Kaplan–Meier curve between Lactobacillus and cardiac death.
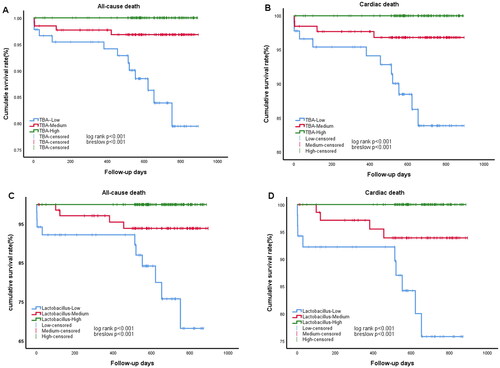
Figure 5. Multivariate COX hazard model adjusted for age, smoking, old myocardial infarction (OMI), systolic pressure, left ventricular ejection fraction (LVEF), serum creatinine (Scr), B-type natriuretic peptide (BNP) max, serum total bile acid (TBA) and Lactobacillus. HR: hazard ratio. (A) Left panel represents the results of serum total bile acid (TBA) and Lactobacillus for all-cause death in ACS patients; right panel represents the results of serum total bile acid (TBA) and Lactobacillus in AMI patients (upper) and UAP patients (lower). (B) Left panel represents the results of serum total bile acid (TBA) and Lactobacillus for all-cardiac death in ACS patients; right panel represents the results of serum total bile acid (TBA) and Lactobacillus in AMI patients (upper) and UAP patients (lower).
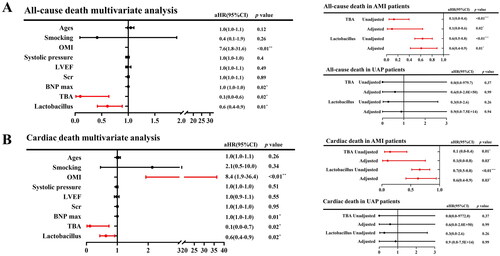
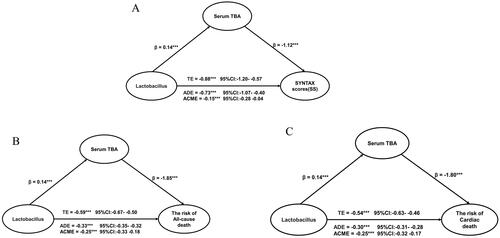
Figure 6. The coefficients relating Lactobacillus with SYNTAX score, the risk of all-cause death and the risk of cardia death, and the mediation effect of serum TBA. (A) Association between Lactobacillus and SYNTAX score mediated by serum TBA. (B) Association between Lactobacillus and the risk of allcause death mediated by serum TBA. (C) Association between Lactobacillus and the risk of cardiac death mediated by serum TBA. β: coefficients in regression analysis; TE: total effect; ADE: average direct effect; ACME: average causal mediation effect; CI: confidence interval.
Supplemental Material
Download MS Word (33.1 KB)Data availability statement
The authors confirm that the data supporting the findings of this study are available within the article and its supplementary materials.