
Figures & data
Figure 1. Schematic flow-chart of the study. Tg: thyroglobulin; anti-TgAb: anti-thyroglobulin antibody; ECT: emission computed tomography.
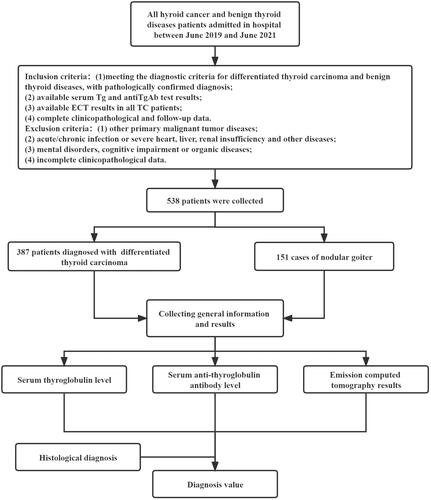
Table 1. Baseline data.
Table 2. Comparison of thyroglobulin diagnosis and pathological results.
Table 3. Comparison of anti-thyroglobulin antibody diagnosis and pathological results.
Table 4. Comparison of ECT diagnosis and pathological results.
Table 5. Comparison of thyroglobulin and anti-thyroglobulin antibody combined with ECT diagnosis and pathological results.
Figure 2. ROC Curves of different diagnostic methods. Tg: thyroglobulin; anti-TgAb: anti-thyroglobulin antibody; ECT: emission computed tomography.
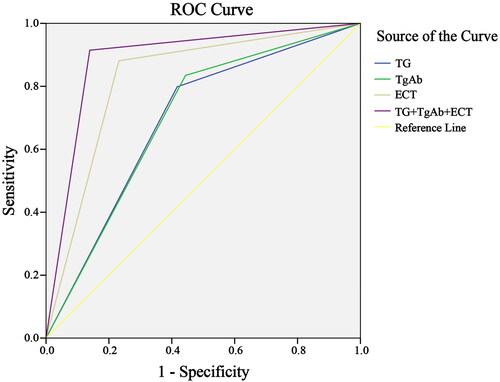
Table 6. ROC curve analysis.
Table 7. Diagnostic efficacy of Tg, TgAb and ECT (alone or in combination) in patients with differentiated thyroid carcinoma.
Data availability Statement
The labeled dataset used to support the findings of this study are available from the corresponding author upon request.