
Figures & data
Table 1. Descriptive data, and disease duration in 13 ATTRv patients (all with a V30M gene mutation, 11 with positive amyloid biopsy finding, two with positive Table FootnoteaDPD-scintigraphy).
Figure 1. Ultrasound images in a patient with hereditary transthyretin amyloidosis (A) of the median nerve at the wrist, proximal to the carpal tunnel, (B) of the sural nerve, and in a healthy control (C) of the median nerve at the wrist, proximal to the carpal tunnel, (D) of the sural nerve. Arrows showing the cross-section area (CSA) mm2.
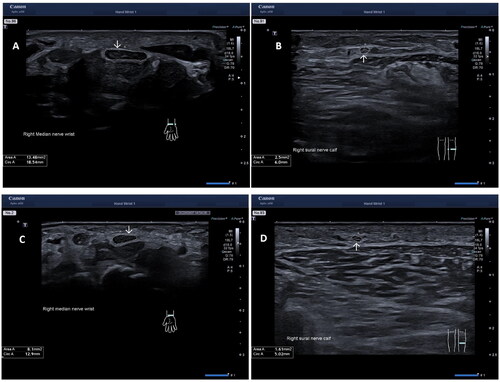
Table 2. Age, gender, disease symptom duration, fibril type, and summary of nerve conduction findings in 13 patients with confirmed hereditary transthyretin amyloidosis.
Figure 2. Boxplots showing cross-sectional areas (CSA) between 13 patients with hereditary transthyretin amyloidosis (ATTRv) and 14 healthy controls. The box shows median and percentage between 25 and 75. The whiskers showing the 95- percentage confidence interval (numbers indicating CSA data outside the 95% confidence interval). (A) CSA at the tibial nerve at the ankle, (B) CSA at the sural nerve, (C) CSA of the ulnar nerve (middle of the upper arm), and (D) Merged CSA = median CSA from the: tibial nerve at the ankle + sural nerve + peroneal nerve at popliteal fossa + median nerve at the wrist + ulnar nerve at the medial epicondyle.
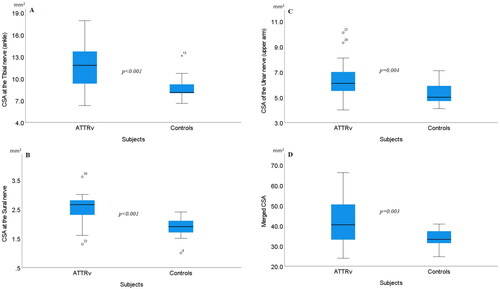
Table 3. Ultrasound cross-sectional area data (mean, range) at 11 nerve sites, in 13 patients with hereditary transthyretin amyloidosis (ATTRv) and 14 controls.
Figure 3. Boxplots showing cross-section areas (CSA) at the median nerve (wrist) between patients with late onset hereditary transthyretin amyloidosis (ATTRv), having fibril-type A and type B. The box shows median and percentage between 25 and 75. The whiskers showing the 95% confidence interval (numbers indicating CSA data outside the 95% confidence interval).
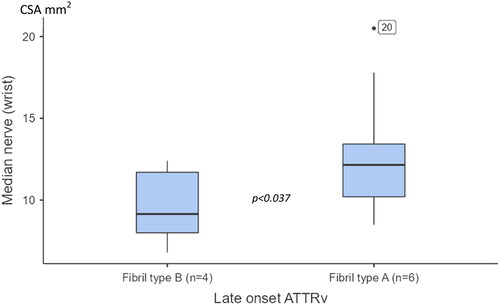
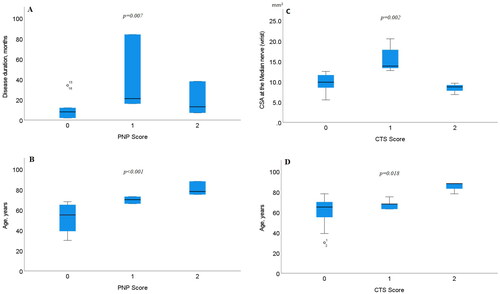
Figure 4. Boxplots showing differences with PNP scoring and (A) disease duration, (B) age of the patient, (C) CTS scoring and CSA at the median nerve at the wrist (MEDw), and (D) age of the patient. The box shows median and percentage between 25 and 75. The whiskers showing the 95% confidence interval (numbers indicating CSA data outside the 95% confidence interval).
Data availability statement
Data available on request due to privacy/ethical restrictions.