
Figures & data
Figure 1. Prisma flow chart; flowchart illustrating the selection process of articles included in the meta-analysis, from an initial 25 articles identified, to the final inclusion of 3 randomized controlled trials (RCTs) after eliminating duplicates, assessing titles and abstracts, and considering only comparative studies for the analysis.
Figure 2. Forest plot of change in HbA1C (Glycated hemoglobin); the figure provides a comparison of the effects of once-weekly Semaglutide treatment and once-daily Sitagliptin on HbA1c values. The analysis demonstrates that once-weekly Semaglutide treatment leads to a significant decrease in HbA1c values compared to once-daily Sitagliptin. Notably, the 1 mg dose of Sitagliptin exhibits a more substantial reduction in HbA1c values; WMD- weighted mean difference; CI- Confidence interval; M-H- Mantel Hansel.
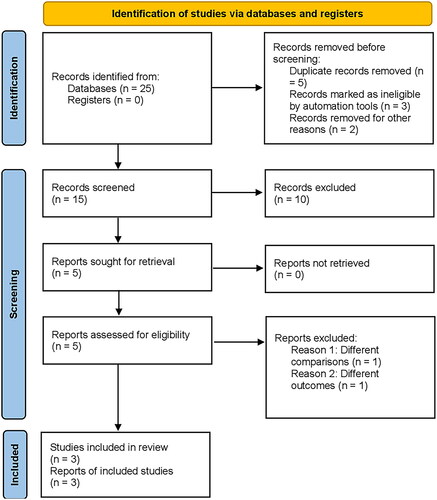
Table 1. Baseline characteristics of the included participants.
Table 2. Baseline Demographics of the included participants.
Figure 3. Forest plot of change in mean SBP (systolic blood pressure); the Figure demonstrates a pooled analysis comparing once-weekly Semaglutide and once-daily Sitagliptin, revealing a significant reduction in mean SBP with Semaglutide treatment compared to Sitagliptin. The decrease is more noticeable when the 1 mg dose of Sitagliptin is taken into account; WMD- weighted mean difference; CI- Confidence interval; M-H- Mantel Hansel.
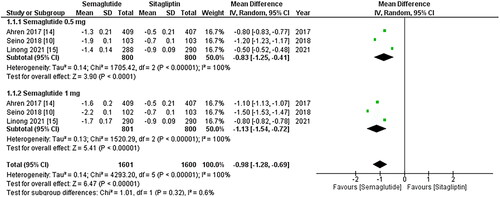
Figure 4. Forest plot of change in mean DBP (Diastolic blood pressure); the figure demonstrates a significant decrease in mean DBP with once-weekly Semaglutide compared to once-daily Sitagliptin, with greater reduction observed for the 1 mg dose; WMD- weighted mean difference; CI- Confidence interval; M-H- Mantel Hansel.
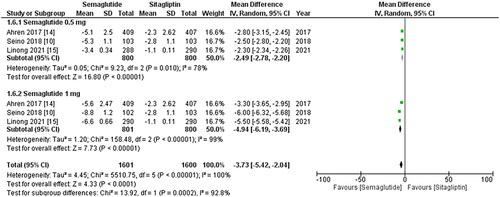
Figure 5. Forest plot of change in pulse rate; the figure demonstrates a significant increase in pulse rate associated with once-weekly Semaglutide treatment compared to once-daily Sitagliptin. Furthermore, the increase in pulse rate was more pronounced in patients taking the 1 mg once-weekly dose of Semaglutide; WMD- weighted mean difference; CI- Confidence interval; M-H- Mantel Hansel.
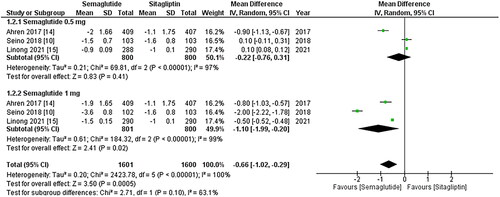
Figure 6. Forest plot of change in body weight; the figure shows a significant decrease in body weight after treatment with once-weekly Semaglutide compared to once-daily Sitagliptin. Additionally, the 1 mg dose of Semaglutide exhibited a more remarkable reduction in body weight than the 0.5 mg dose; WMD- weighted mean difference; CI- Confidence interval; M-H- Mantel Hansel.
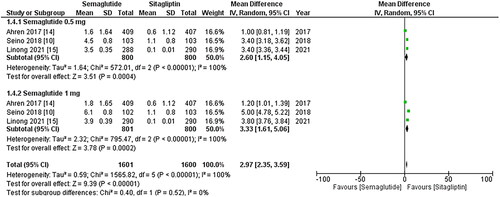
Figure 7. Forest plot of change in waist circumference; the analysis showed waist circumference reduction with once-weekly Semaglutide, Highlighting enhanced effects at 1 mg dose; WMD- weighted mean difference; CI- Confidence interval; M-H- Mantel Hansel.

Figure 8. Forest plot of change in Body mass index (BMI); the figure demonstrates a significant decrease in BMI after treatment with the once-weekly Semaglutide regimen compared to the once-daily Sitagliptin regimen. Notably, the 1 mg dose of Semaglutide resulted in a more notable reduction in BMI than the 0.5 mg dose; WMD- weighted mean difference; CI- Confidence interval; M-H- Mantel Hansel.
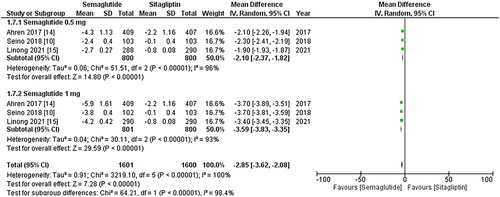
Figure 9. .

Table 3. Secondary outcomes.
Supplemental Material
Download MS Word (784.8 KB)Supplemental Material
Download MS Word (14.3 KB)Data availability statement
Data Availability Statement: The data supporting the findings of this study, titled ‘ Comparative Efficacy and Safety Profile of once-weekly Semaglutide versus once-daily Sitagliptin as an add-on to Metformin in Patients with Type 2 Diabetes: A Systematic Review and Meta-Analysis’ are available on PubMed and can be accessed via their respective DOI (Digital Object Identifier). Interested researchers can retrieve the data by searching for the article using the provided DOI. Should additional information or data be required for the purpose of verification, replication, or further analysis, the corresponding authors of the study can be contacted.
Their contact details are as follows: Tirath Patel
Institute: American University of Antigua
Email: [email protected] contact: 091-8128250661
Department: Medicine country: Antigua and Barbuda
The authors are committed to promoting transparency and facilitating scientific progress. While the primary data are available on PubMed, the corresponding authors are willing to assist researchers in accessing any additional information that may be necessary to support their work.