
Figures & data
Table 1. Basic clinical characteristics of initial sample group.
Table 2. Basic clinical characteristics of validation sample group.
Figure 1. miRNA microarray quality control images. A. Reflects correct grid selection. B: Reflects clean chip cleaning. C. Reflects chip signal distribution range. D. Reflects background noise of chip. E. Reflects fluorescence signal distribution. F. Quality Control Metrics-plot of miRNA microarray data. Indicators are as follows: Any color PrcntFeatPopnOL: percentage content of Feature escape value; gTotalSignal75pctiIe: 75% value of all gene signals; Add Error Estimate Green: additional error value; gNon Ctrl Med Prcnt CVBG Sub Sig: coefficient of variation value to remove background signal. G. Each point represents one case. Red: early recurrence metastasis group. Blue: no recurrence metastasis group.
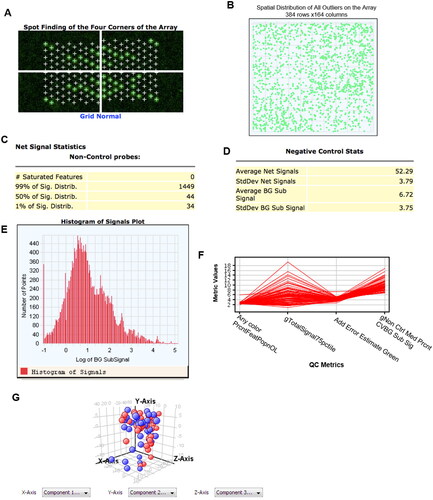
Table 3. Differentially expressed miRNAs in the initial sample group (based on p value and Fold change).
Figure 2. Relationship between expression levels of eight candidate differentially expressed miRNAs and progression-free survival (PFS) in the initial sample group. A. Relationship between miR-1260b expression and prognosis of patients, p = 0.001. B. Relationship between miR-21-3b expression and prognosis of patients, p = 0.02. C. Relationship between miR-4514 expression and prognosis of patients, p = 0.024. D. Relationship between miR-4659a-3p expression and prognosis of patients, p = 0.009. E. Relationship between miR-2467-3p expression and prognosis of patients, p < 0.001. F. Relationship between miR-3621 expression and prognosis of patients, p = 0.026. G. Relationship between miR-1471 expression and prognosis of patients, p = 0.013. H. Relationship between miR-92a-3p expression and prognosis of patients, p = 0.011. I. Heatmap of eight candidate miRNAs. The abscissa is the case and the ordinate is eight candidate miRNAs.
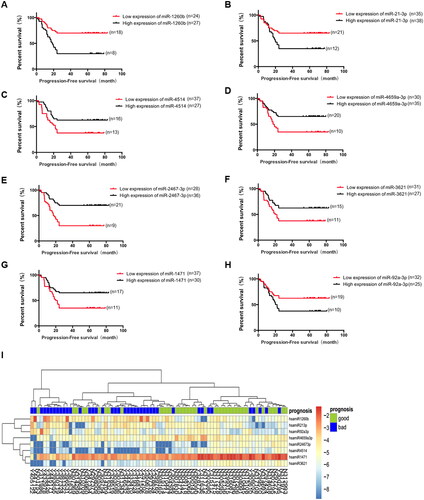
Table 4. Differentially expressed miRNAs in the initial sample group (based on p value, Fold change and patient survival analysis).
Figure 3. Real-time PCR validation of candidate miRNAs in validation sample group. A. miR-2467-3p expression level in validation sample group, p > 0.05. B. miR-21-3p expression level in validation sample group, *: p = 0.02. C. miR-1260b expression level in validation sample group, p > 0.05. D. miR-92a-3p expression level in validation sample group, p > 0.05. E. miR-3621 expression level in validation sample group, p > 0.05.
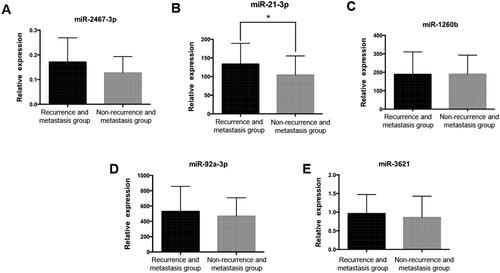
Figure 4. The ROC curve for the early recurrence and metastasis group and the non-recurrence and metastasis group. A. The area under the ROC curve was 0.917, p < 0.001. B. Prognostic index in the initial sample group and progression-free survival in patients with lung adenocarcinoma, p < 0.001. C. Prognostic index in the validation sample group and progression-free survival in patients with lung adenocarcinoma, p < 0.001.
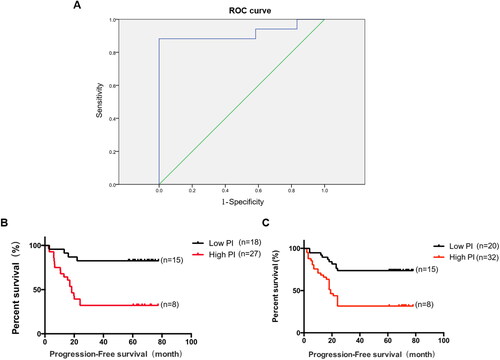
Table 5. Multivariate Cox regression analysis results for the initial sample group.
Table 6. Chi-square test for paired design between PI prediction results of initial sample group and actual patient survival.
Table 7. Chi-square test for paired design between PI prediction results of validation sample group and actual patient survival.
Data availability statement
All data generated or analyzed during this study are included in this article.