
Figures & data
Figure 1. Gastric adenocarcinoma without mucinous component. B. Adenocarcinoma with mucinous component. H + E staining.
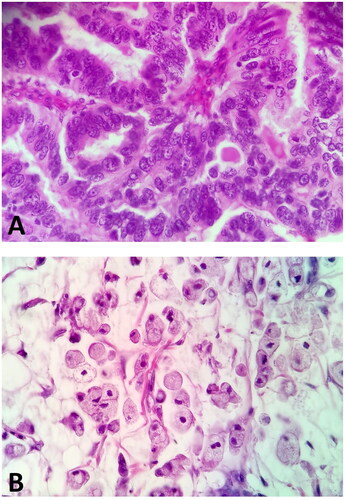
Table 1. Characteristics of study group.
Figure 2. Non-enzymatic and enzymatic antioxidants in patients with gastric cancer and the control group. Abbreviations: SOD: superoxide dismutase-1; CAT: catalase; GPx: glutathione peroxidase; GR: glutathione reductase; GSH: reduced glutathione. The data are presented as median (minimum - maximum). *p < 0.05, ****p < 0.0001.
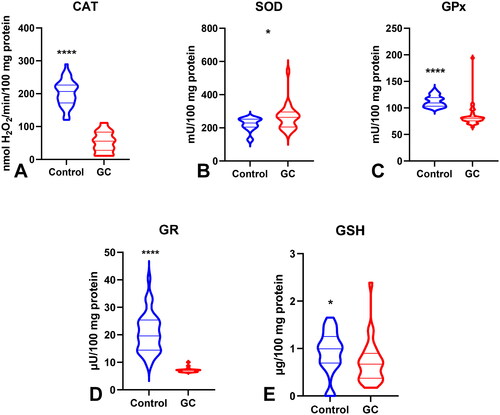
Figure 3. Total antioxidant/oxidant status in patients with gastric cancer and the control group. Abbreviations: TAC: total antioxidant capacity; TOS: total oxidant status; OSI: oxidative stress index. The data are presented as median (minimum - maximum). ****p < 0.0001.
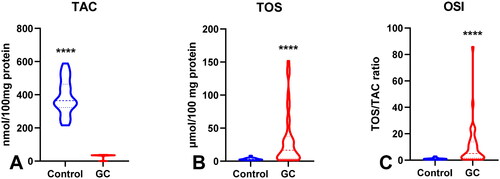
Figure 4. Oxidative damage to proteins, lipids and DNA in patients with gastric cancer and the control group. Abbreviations: IMA: ischaemia-modified albumin; AOPP: advanced oxidation protein products; LOOH: lipid hydroperoxides; 8-Iso-P: 8-Isoprostane. The data are presented as median (minimum - maximum). **p < 0.01, ****p < 0.0001.
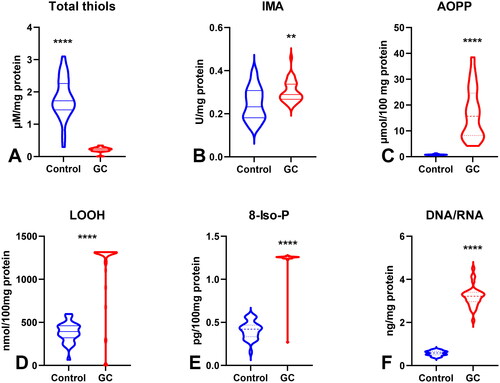
Figure 5. Comparison of AOPP concentration (A) between patients with tumours diameter ≤5cm and >5cm; AOPP (B) and LOOH (C) concentration between patients with adenocarcinoma and adenocarcinoma mucinosum; GPx (D), TOS (F) and total thiols (F) between patients with tumours in G2 and G3 stage. Abbreviations: AOPP: advanced oxidation protein products; LOOH: lipid hydroperoxides; GPx: glutathione peroxidase; TOS: total oxidant status. The data are presented as median (minimum - maximum). *p < 0.05, **p < 0.01.
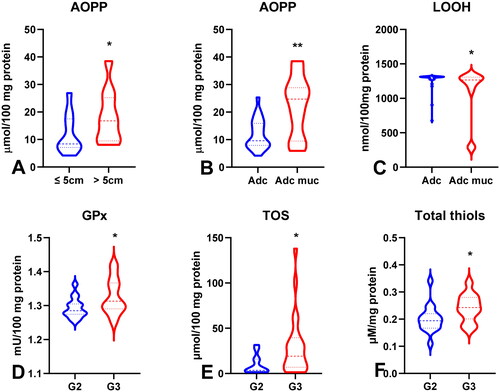
Figure 6. Comparison of SOD (a), CAT (B), GPx (C), TOS (D), OSI (E) and AOPP (F) between patients with tumours in T1 and T2 stage vs T3 and T4 stage. Abbreviations: SOD: superoxide dismutase-1; CAT: catalase, GPx: glutathione peroxidase; TOS: total oxidant status; OSI: oxidative stress index; AOPP: advanced oxidation protein products. The data are presented as median (minimum - maximum). *p < 0.05, **p < 0.01.
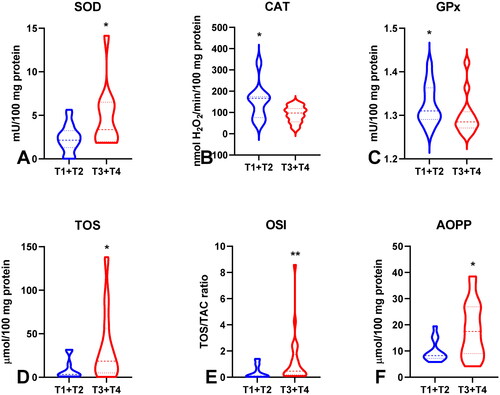
Figure 7. Comparison of GR (a), GSH (B), TOS (C), OSI (D), AOPP (E) and total thiols (F) between groups of patients without and with lymph node metastasis. Abbreviations: GR: glutathione reductase; GSH: reduced glutathione; TOS: total oxidant status; OSI: oxidative stress index; AOPP: advanced oxidation protein products. The data are presented as median (minimum - maximum). *p < 0.05, **p < 0.01.
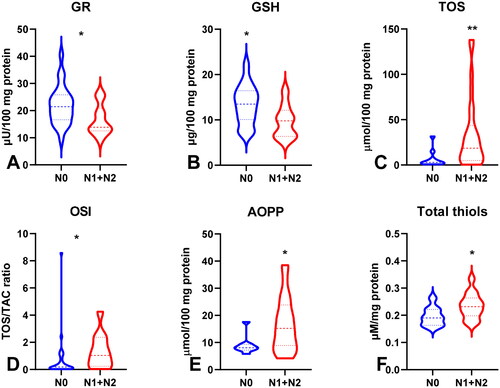
Figure 8. Comparison of SOD (a), GSH (B), TOS (C) and AOPP (D) between groups of patients without and with distant metastasis. Abbreviations: GR: glutathione reductase; GSH: reduced glutathione; TOS: total oxidant status; OSI: oxidative stress index; AOPP: advanced oxidation protein products. The data are presented as median (minimum - maximum). *p < 0.05.
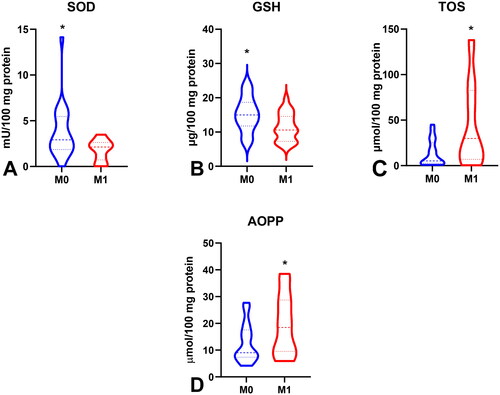
Figure 9. Comparison of CAT (a), GR (B), GPx (C), GSH (D), TAC (E) and AOPP (F) between groups of patients with intestinal and diffuse type of gastric cancer according to lauren’s classification; CAT (G), GSH (H) and total thiols between I + II and III + IV type of gastric cancer according to Goseki classification. Abbreviations: CAT: catalase; GR: glutathione reductase; GPx: glutathione peroxidase; GSH: reduced glutathione; TAC: total antioxidant capacity; AOPP: advanced oxidation protein products. The data are presented as median (minimum - maximum). *p < 0.05, **p < 0.01.
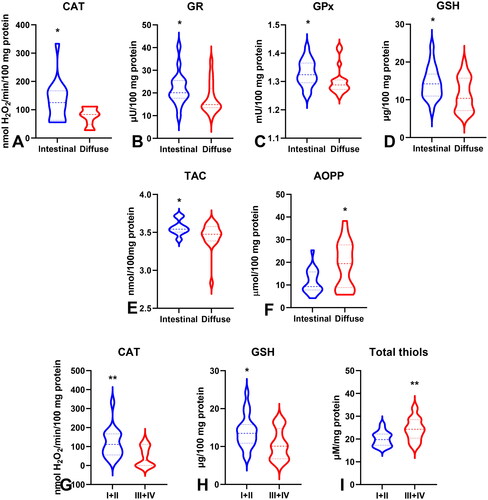
Figure 10. Comparison of GR (a), GPx (B), GSH (C) between groups of patients with absent and present vascular infiltration; GSH level (D) between groups of patients with absent and present neural infiltration. Abbreviations: GR: glutathione reductase; GPx: glutathione peroxidase; GSH: reduced glutathione. The data are presented as median (minimum - maximum). *p < 0.05, **p < 0.01, ***p < 0.001, ****p < 0.0001.
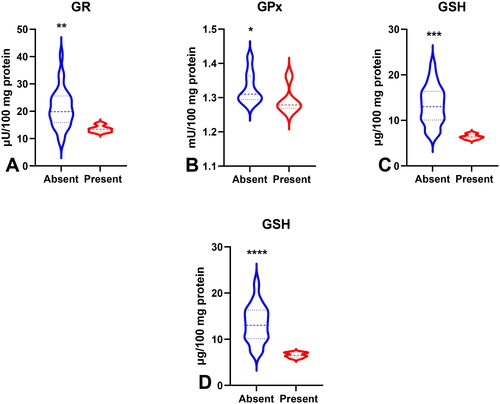
Table 2. Receiver operating characteristic (ROC) analysis of oxidative stress biomarkers of gastric cancer patients and the controls.
Table 3. Receiver operating characteristic (ROC) analysis in gastric cancer patients for histological type, histological differentiation grade, depth of tumour invasion, presence of lymph node and distant metastasis.
Table 4. Receiver operating characteristic (ROC) analysis in gastric cancer patients for type of GC according to Lauren and Goseki classifications and vascular and neural infiltration.
Figure 11. Heat map of correlations between redox biomarkers and histopathological parameters in patients with gastric cancer.
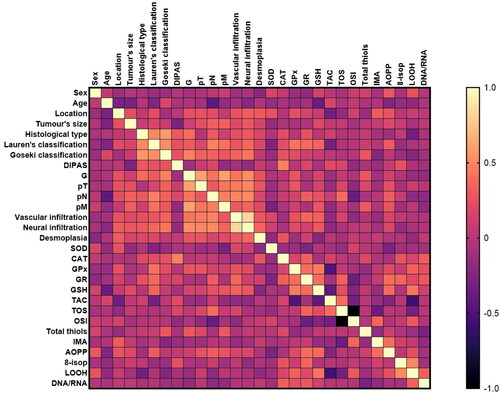
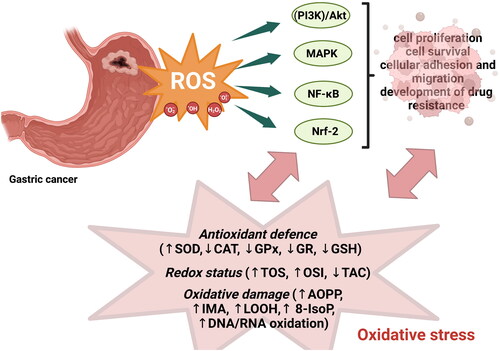
Figure 12. Results of activation of ROS-inititated signalling mechanisms.
Data availability statement
The full data presented in this study are available upon request from the corresponding author.