
Figures & data
Figure 1. Definition and Grouping for NPS. Point score 0 as NPS group 0; Point score 1 or 2 as NPS group 1; Point score 3 or 4 as NPS group 2. Abbreviations: neutrophil to lymphocyte ratio (NLR), lymphocyte to monocyte ratio (LMR), Naples prognostic score (NPS).
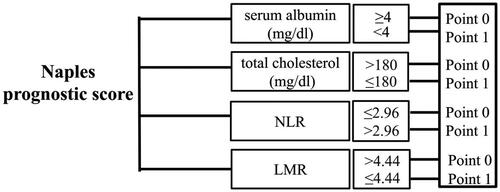
Table 1. Patients characteristics.
Table 2. The laboratory biomarkers.
Figure 2. ROC Curve of NPS for recurrence prediction. Abbreviations: Receiver operating characteristic (ROC); Naples prognostic score (NPS).
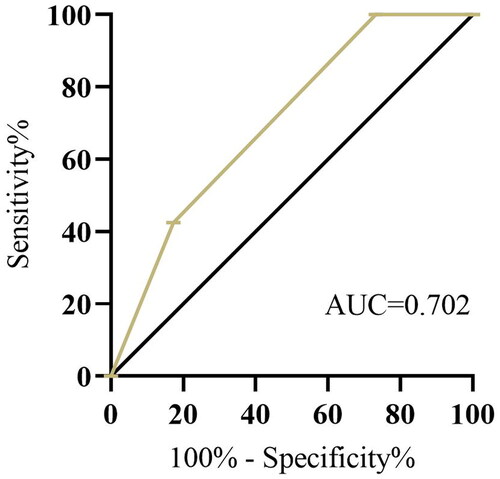
Table 3. Relationship between NPS and clinicopathological characteristics.
Figure 3. Correlations between serum albumin, total cholesterol, NLR, and LMR. a serum albumin and total cholesterol. b serum albumin and NLR. c serum albumin and LMR. d total cholesterol and NLR. e total cholesterol and LMR. f NLR and LMR. Abbreviations: neutrophil to lymphocyte ratio (NLR), lymphocyte to monocyte ratio (LMR).
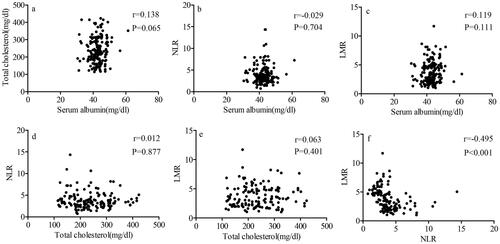
Figure 4. Kaplan-Meier survival curves of OS (A) and PFS (B) according to NPS group for all patients. Abbreviations: Overall survival (OS), Progression-free survival (PFS).
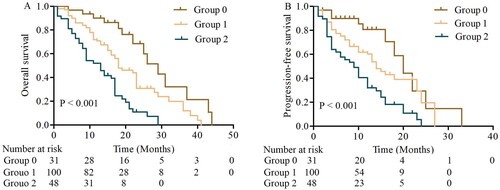
Figure 5. Kaplan-Meier survival curves of OS and PFS according to NPS group for LS-SCLC patients (A, OS; B, PFS) and ES-SCLC patients (C, OS; D, PFS). Abbreviations: Overall survival (OS), Progression-free survival (PFS).
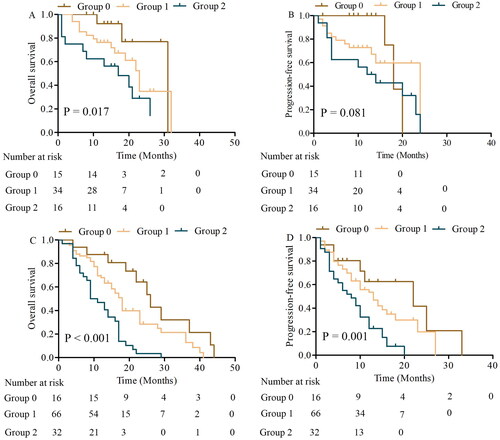
Table 4. Univariate analysis about impact of variables on OS and PFS.
Table 5. Multivariate analysis about impact of variables on OS and PFS.
Data availability statement
The datasets used and analyzed during the current study are available from the corresponding author on reasonable request.