
Figures & data
Figure 1. Study flow chart.
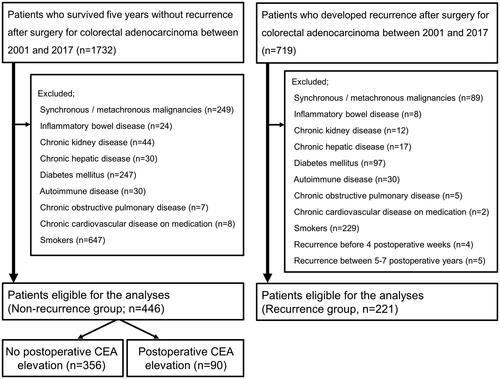
Table 1. Comparative profile of patients according to recurrence.
Table 2. Profile of patients without recurrence according to postoperative CEA elevation.
Figure 2. Evaluation of candidate measures using CEA values for discriminating recurrence from non-recurrence. (A) Distribution of raw CEA levels during the postoperative period. The number of readings for each CEA range was shown according to recurrence. One patient who did not take a CEA test at the time of recurrence was excluded. White bar indicates non-recurrence, and black bar indicates recurrence. (B) Receiver operating characteristic (ROC) curve for the relationship between postoperative CEA value and recurrence. AUC: area under the curve. (C) Distribution of postoperative CEA ratio to the preoperative value. The number of readings for each range of the relative ratio was shown according to recurrence. Patients who did not take a CEA test before colorectal surgery were excluded. White bar indicates non-recurrence, and black bar indicates recurrence. (D) ROC curve for the relationship between postoperative CEA ratio to the preoperative value and recurrence. (E) Distribution of postoperative CEA ratio to the nadir. The number of readings for each range of the relative ratio was shown according to recurrence. One patient who did not take a CEA test at the time of recurrence was excluded. White bar indicates non-recurrence, and black bar indicates recurrence. (F) ROC curve for the relationship between postoperative CEA ratio to the nadir and recurrence.
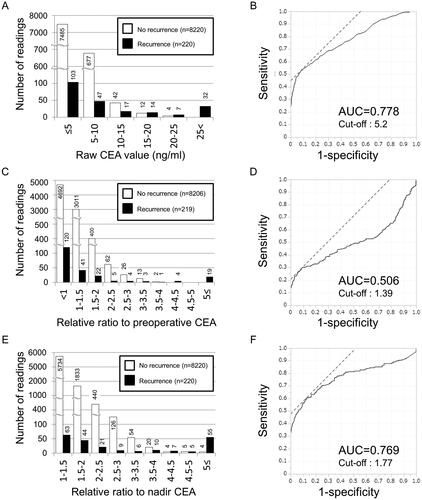
Figure 3. Typical patterns of false-positive elevations of CEA after colorectal cancer surgery. Examples of longitudinal changes in CEA are shown. The relationships between changes in CEA and seasons are tabulated. The relationships between the patterns of CEA elevations and preoperative CEA levels are also shown.
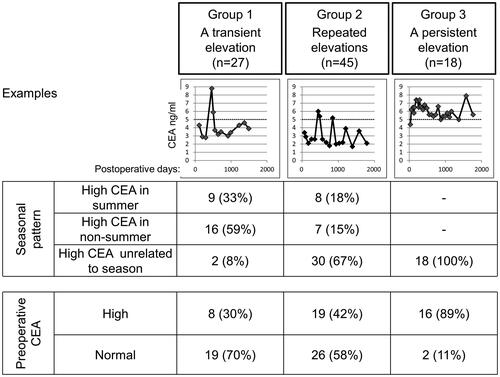
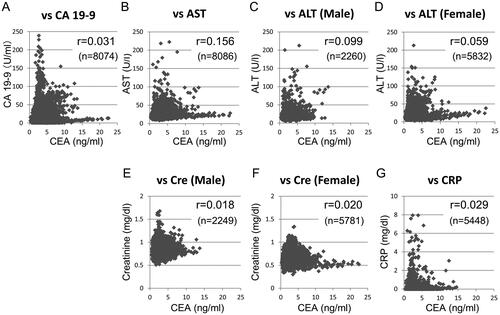
Figure 4. Scatter plot analyses of serum CEA and other blood test data in colorectal cancer patients without recurrence. Serum CEA was plotted against (A) CA 19-9, (B) AST, (C) ALT in men, (D) ALT in women, (E) creatinine in men, (F) creatinine in women, and (G) CRP. The coefficient (r) and total number of blood tests (n) are shown in each graph. There are some outlying data that were not displayed in the graphs.
Data availability statement
The datasets generated during and/or analyzed during the current study are available from the corresponding author upon reasonable request.