
Figures & data
Figure 1. Levels of mRNAs for the microglia marker CD11b and pro-inflammatory cytokines TNF-α and IL6 in the mPFC, BLA, and CA1 of female grass rats exposed to BLT or control red light. Data are shown as Means ± SEMs, n = 8/group. *p < 0.05. Controls are set to 1.0.
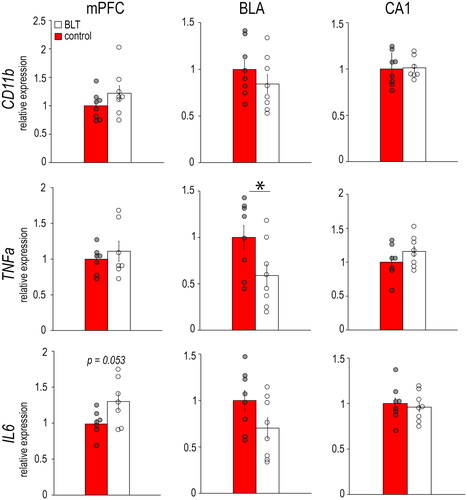
Figure 2. Levels of mRNAs for microglia marker CD11b and pro-inflammatory cytokines TNF-α and IL6 in the mPFC, BLA, and CA1 of male grass rats exposed to BLT or control red light. Data are shown as Means ± SEMs, n = 6/group. *p < 0.05. Controls are set to 1.0.
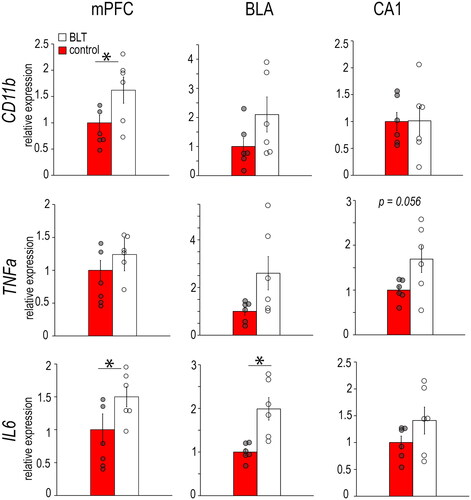
Figure 3. Levels of mRNAs for neuroplasticity markers BDNF and TrkB in the mPFC, BLA, and CA1 of female grass rats exposed to BLT or control red light. Data are shown as Means ± SEMs, n = 8/group. *p < 0.05. Controls are set to 1.0.
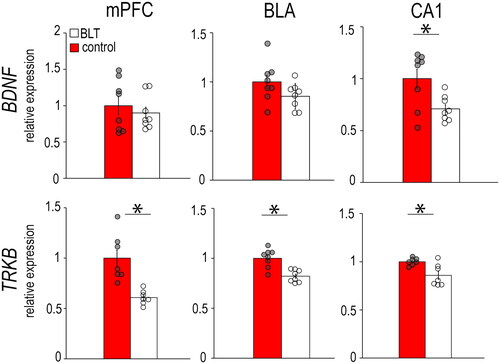
Figure 4. Levels of mRNAs for neuroplasticity markers BDNF and TrkB in the mPFC, BLA, and CA1 of male grass rats exposed to BLT or control red light. Data are shown as Means ± SEMs, n = 6/group. *p < 0.05. Controls are set to 1.0.
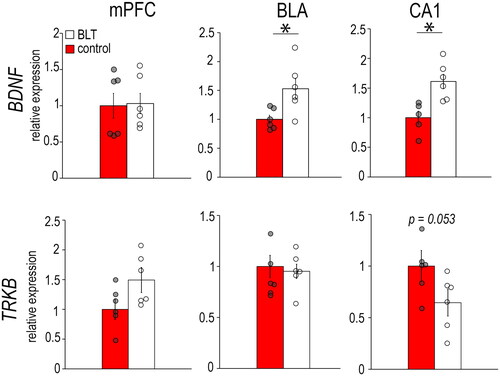
Table 1. Summary of mRNA expression of neuroinflammatory markers CD11b, TNF-α, and IL6, and neuroplasticity markers BDNF and TrkB in the medial prefrontal cortex (mPFC), basolateral amygdala (BLA), and CA1 subregion of the hippocampus (CA1) of female and male grass rats exposed to BLT.
Data availability statement
The data supporting the findings of this study are viewable within the article’s figures and will be made available in spreadsheet form upon request made to the corresponding author.