
Figures & data
Figure 1. Flow chart of study design.
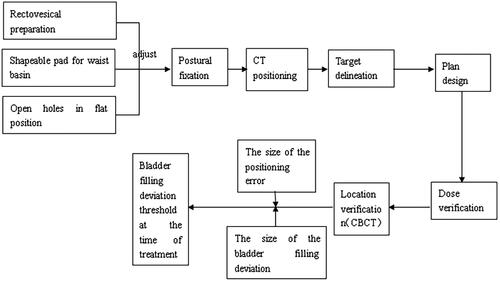
Figure 2. Schematic diagram of measuring the length, width and height of the bladder (three axial lengths).
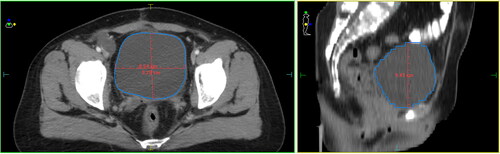
Figure 3. Linear correlation between bladder filling and positioning. The X-axis is the pendulum error value, and the Y-axis indicates the number of cases corresponding to a certain error. Three lines are shown, respectively: green Rt-Lt is the horizontal direction (Right-Left); red Sup-Inf is the longitudinal direction (Superior-Inferior); and blue Ant-Post is the vertical (Anterior-Posterior) direction.
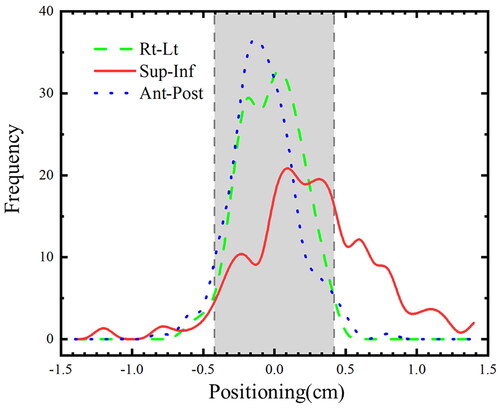
Table 1. Positioning error under different bladder filling deviations (x- ± s, cm).
Table 2. Bladder filling deviation with different positioning errors (x- ± s, %).
Table 3. Different positioning states with different bladder filling deviations.
Table 4. The positioning error of patients with inferior positioning status in different directions.
Data availability statement
The data supporting the findings of this study are available within the article.