
Figures & data
Figure 1. Expression of CAF-related genes in breast cancer tissues and normal tissues. Compared with normal breast tissue, THY1, PDPN, FAP, S100A4, DPP4, PDGFRA, PDGFRB, and TNC were higher in breast cancer.
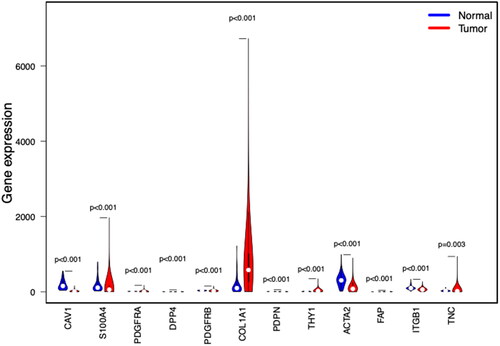
Figure 2. The results of GO and KEGG analysis of CAF-related genes. The bar plot (A) and circos plot (C) showed the top five GO terms; the bar plot (B), bubble plot and circos plot (D) showed the top five KEGG pathway terms BP biological process.
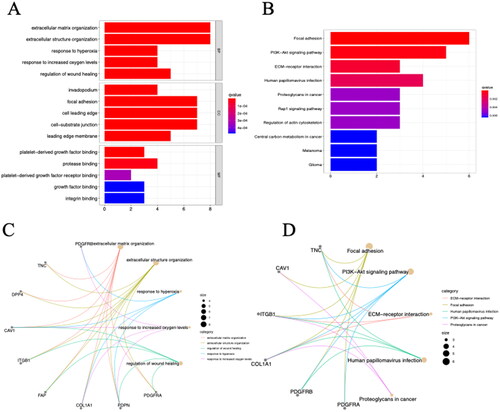
Figure 3. The relationship between PDGFRA and immune infiltrates. The correlation between PDGFRA expression and B cell memory (A), B cells naive (B), DCs resting (C), macrophages M0 (D), macrophages M1(E), macrophages M2 (F), mast cells activated (G), mast cells resting (H), monocytes (I), plasma cells (J), T cells CD4 memory resting (K) infiltration. R < 0, negative correlation, R = 0, no correlation, R > 0, positive correlation.
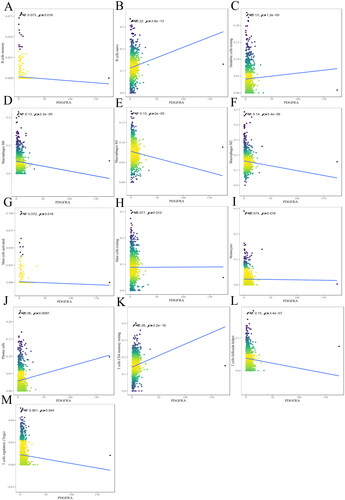
Figure 4. The relationship between PDGFRB and immune infiltrates. The correlation between PDGFRB expression and B cell memory (A), B cells naive (B), DCs activated (C), DCs resting (D), eosinophils (E), macrophages M1 (F), mast cells activated (G), mast cells resting (H), T cells CD4 memory activated (I), T cells CD4 memory resting (J), T cells CD8 (K), T cells follicular helper (L) infiltration. R < 0, negative correlation, R = 0, no correlation, R > 0, positive correlation.
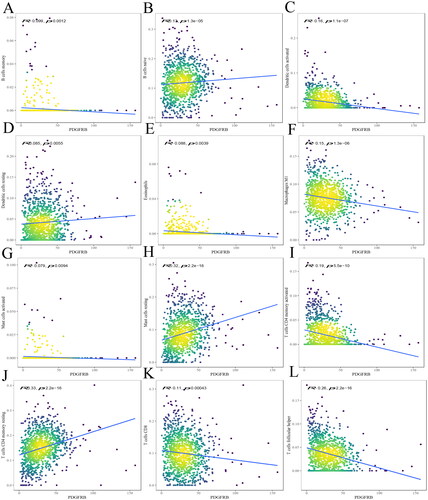
Figure 5. The relationship between TNC and immune infiltrates. The correlation between TNC expression and B cells naive (A), DCs activated (B), DCs resting (C), eosinophils (D), macrophages M1 (E), macrophages M2 (F), monocytes (G), T cells CD4 memory resting (H), T cells CD8 (I) infiltration. R < 0, negative correlation, R = 0, no correlation, R > 0, positive correlation.
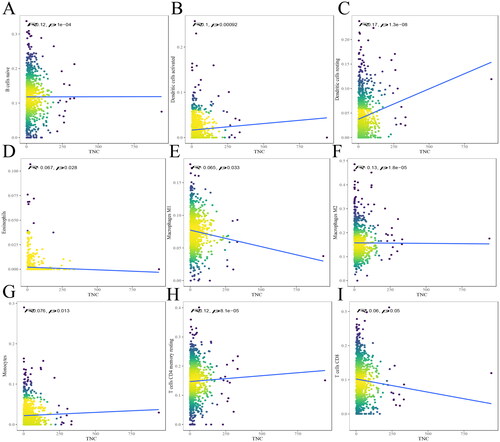
Figure 6. Kaplan–Meier Plots comparing the OS between the high and low groups of PDGFRA (a), PDGFRB (B), TNC (C) in the TCGA-BRCA cohort. p Values from log-rank tests.
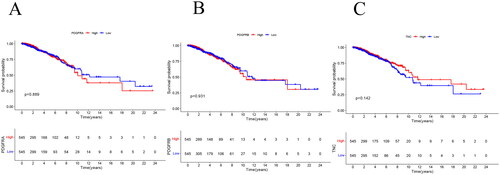
Figure 7. Representative images of immunohistochemistry staining IDC-NOS patients tissues showing the expression of TNC. (A) TNC low expression in the CAF; (B) TNC high expression in the CAF; (C) TNC low expression in the tumor cells; (D) TNC high expression in the tumor cells. Magnification ×100, and ×400; the solid black line indicates the scale bar, 100 μm.
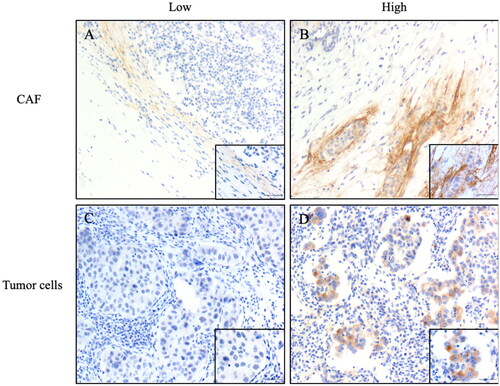
Table 1. Correlation between TNC expression and clinicopathological characteristics of IDC-NOS patients(n = 160).
Figure 8. Kaplan–Meier curves of the MFS in IDC-NOS by the TNC expression. MFS survival curve of TNC expression in CAF (A) and tumor cells (C); OS survival curve of TNC expression in CAF (B) and tumor cells (D).MFS: metastasis-free survival; OS: overall survival.
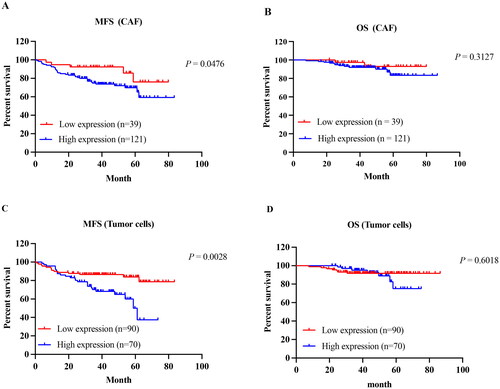
Table 2. Relationship between clinicopathological characteristics and disease-free survival in patients with ICD-NOS patients.
Supplemental Material
Download ()Data availability statement
Publicly available datasets were analyzed in this study. Data can be found here: https://portal.gdc.cancer.gov/. All of the authors are responsible for the data.