
Figures & data
Figure 1. Flowchart of this study.
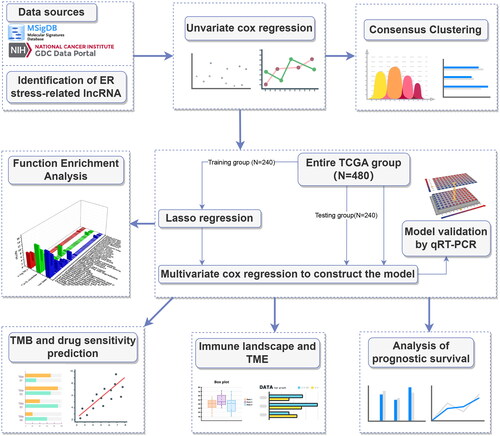
Figure 2. Screening prognosis-related ERs-related lncRNAs as modelling candidates. Heatmap (A) and a volcano plot (B) of differentially expressed lncRNAs in LUAD. (C) The interaction network diagram between ERs-related genes and ERs-related lncRNAs. (D) 77 ERs-related lncRNAs related to prognosis obtained by univariate Cox regression analysis. (E) Differential expression Heatmap of 77 prognosis-related ERs-related lncRNAs. *, **, and *** represent p < 0.05, p < 0.01, and p < 0.001, respectively.
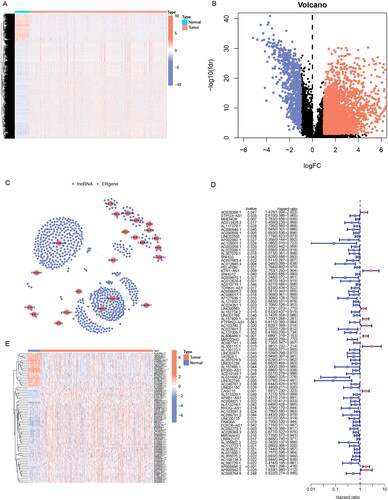
Figure 3. Identification of ERs-related lncRNA Signature. (A) Consensus clustering grouping based on prognosis-related ERs-related LncSig. (B) Empirical cumulative distribution function (CDF) plots display consensus distributions for each k. (C) Survival analysis of two cluster grouping. (D) LASSO coefficient profiles of the 77 prognostic-related ERs-related lncRNAs in the training set. (E) Cross-validation for optimal parameter selection in the LASSO regression. (F) A Sankey diagram of the distribution of samples grouped by cluster and model. CDF, cumulative distribution function.
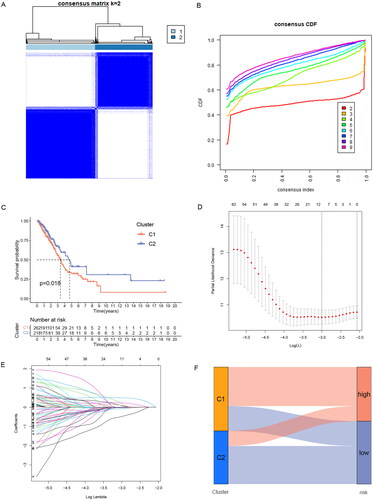
Table 1. Multivariate Cox regression analysis of five prognostic lncRNAs.
Figure 4. Validation of ERs-related LncSig for survival prediction. (A-C) Different Kaplan-Meier curves in the two risk groups stratified by ERs-related LncSig in the training set (A), testing set (B), and entire TCGA set (C). (D-F) ROC curves of the ERs-related LncSig at 1 year in the training set (D), testing set (E), and entire TCGA set (F). (G-I) In training set (G), testing set (H), and entire TCGA set (I), the expression of ERs-related LncSig in each patient, the distribution of risk grade, and the survival status between the two risk groups. (J-N) Differential expression of five model lncRNAs in tumour tissues and normal tissues. ROC, receiver operating characteristic; AUC, the area under the curve; *, **, and *** represent p < 0.05, p < 0.01, and p < 0.001, respectively.
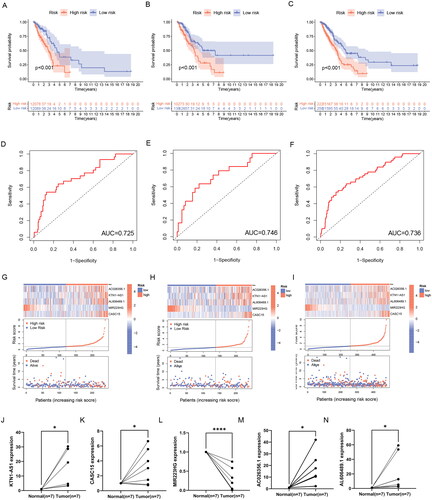
Figure 5. Correlation validation of risk model with clinical characteristics. (A) In the entire TCGA set, univariate independent prognostic analysis of ERs-related LncSig. (B) Multivariate independent prognostic analysis of ERs-related LncSig. (C) Comparison of the 1‑year ROC curve of the ERs-related LncSig and the ROC curves of other clinicopathological features in the entire TCGA set. (D) Heatmap for ERs-related LncSig and the correlation between clinical features and the risk groups. (E) A nomogram predicting 1-, 3-, and 5-year OS of LUAD patients. (F) The calibration curves of the nomogram for 1-year, 3-year, and 5-year survival in LUAD patients. (G-I) ROC curves for prognostic indicators at 1,3 and 5 years. *, **, and *** represent p < 0.05, p < 0.01, and p < 0.001, respectively.
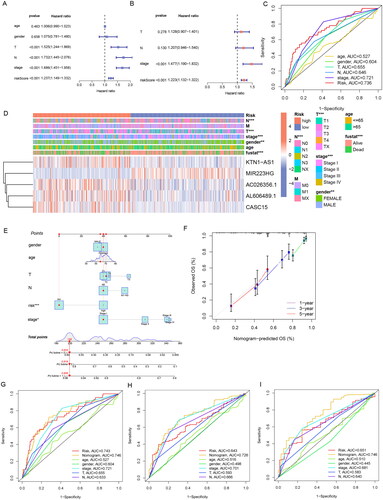
Figure 6. GSEA analysis of ERs-related lncRNA Signature. (A) GSEA analysis of high-risk group calculated by ERs-related LncSig. (B) GSEA analysis of low-risk group calculated by ERs-related LncSig. (C) Correlation of GSEA enriched pathways with each model gene in the high-risk group. (D) Correlation of GSEA enriched pathways with each model gene in the low-risk group.
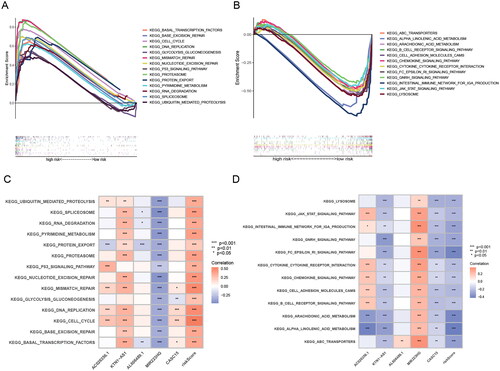
Figure 7. GO and KEGG analysis of ERs-related lncRNA Signature. (A) A Heatmap of DEGs for high- and low-risk groups. (B) A volcano plot of DEGs for high- and low-risk groups. (C-D) Bar chart and circle diagram of the most highly significant enriched results of GO analysis by risk group. (E-F) Bubble plot and circle diagram of the most highly significant enriched results of KEGG analysis by risk group. BP, biological process; CC, cellular component; MF, molecular function.
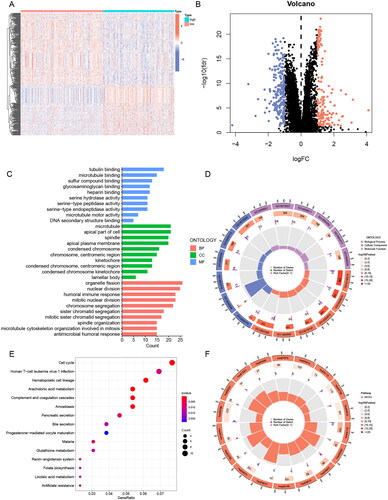
Figure 8. Immune and TME analysis of ERs-related lncRNA Signature. (A) The analysis of tumour immune cell infiltration in high-risk and low-risk groups using the CIBERSORT algorithm. (B) The analysis of tumour immune cell infiltration in high-risk and low-risk groups using MCPcounter algorithm. (C) Differences in immune function between high-risk and low-risk groups. (D) Immune checkpoint differences between high-risk and low-risk groups. (E) The differences in stromal score, immune score, and ESTIMATE score between the low- and high-risk groups. (F) TIDE differences between high-risk and low-risk groups. APC, antigen-presenting cell; CCR, chemokine receptor; HLA, human leukocyte antigen; MHC, major histocompatibility complex; IFN, interferon; *, **, and *** represent p < 0.05, p < 0.01, and p < 0.001, respectively.
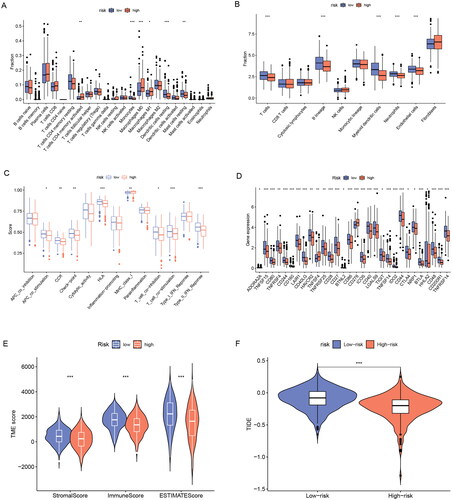
Figure 9. TMB analysis of ERs-related lncRNA Signature. (A) The top 15 genes with the highest mutation rate were in the high-risk group. (B) The top 15 genes with the highest mutation rate were in the low-risk group. (C) TMB differences between high-risk and low-risk groups. (D) Kaplan-Meier survival analysis of high and low TMB patients. E Kaplan-Meier analysis of risk groups combined with TMB.
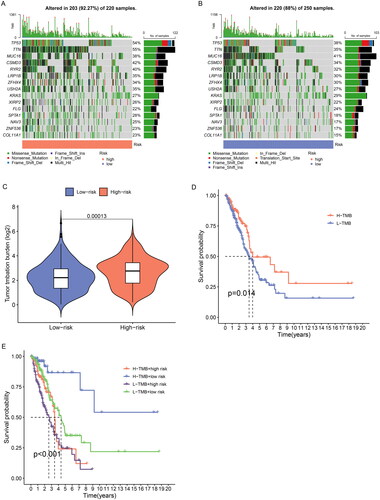
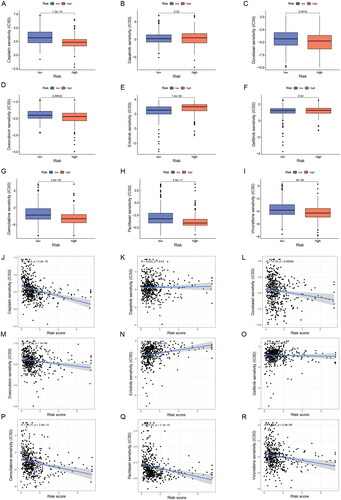
Figure 10. Sensitivity analysis of clinically common chemotherapeutic agents in LUAD. (A-I) The sensitivity difference of commonly used chemotherapeutic agents in LUAD between high- and low-risk groups. (J-R) Correlation plots of risk scores with IC50 of chemotherapeutic agents in TCGA-LUAD patients. IC50, half-maximal inhibitory concentration.
Supplemental Material
Download Zip (3.1 MB)Data availability statement
All data will be provided upon request to the corresponding author.