
Figures & data
© 2023 The Author(s). Published by Informa UK Limited, trading as Taylor & Francis Group
Figure 1. Interview guide used.
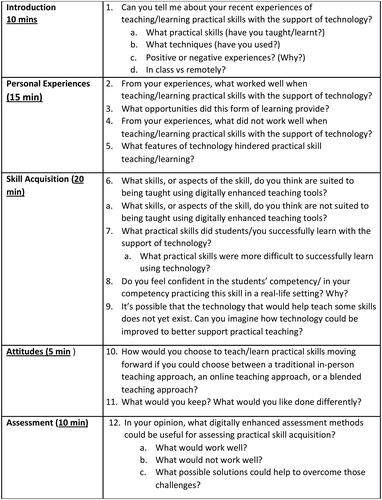
Figure 2. Example of the mapping process between codes and theme.
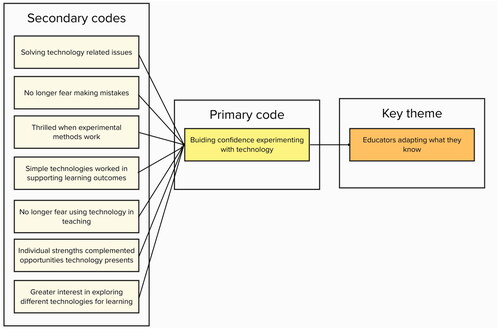
Table 1. Participant group characteristics (N = 18).
Table 2. Themes and corresponding codes generated using reflexive thematic analysis.
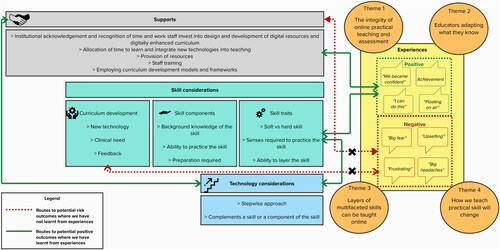
Figure 3. Infographic illustrating main study results and the interplay between variables, experiences and processed as described by participants.
Note. Themes are presented as the four cornerstones to experience.
Supplemental material
Supplemental Material
Download Zip (123.4 KB)Data availability
A completed Standards for Reporting Qualitative Research (SRQR) checklist is available in the supplementary materials. Participants did not consent to having their data shared on an open repository.