
Figures & data
Table 1. Baseline clinical characteristics.
Figure 1. Clinical outcomes and efficacy analysis in EGFR-mutated advanced NSCLC with or without bevacizumab. Kaplan–Meier curves for PFS (A) and OS (B); best response (C), ORR (D) and DCR (E).
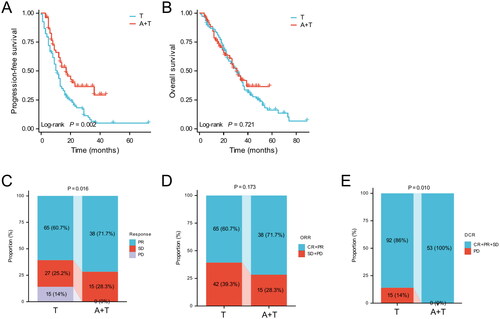
Figure 2. Kaplan–Meier curves of PFS (A) and OS (B) in EGFR-mutated advanced NSCLC receiving EGFR-TKI monotherapy according to ECOG PS. Kaplan–Meier curves of PFS (C) and OS (D) in EGFR-mutated advanced NSCLC receiving EGFR-TKIs monotherapy according to pre-treatment LAR.
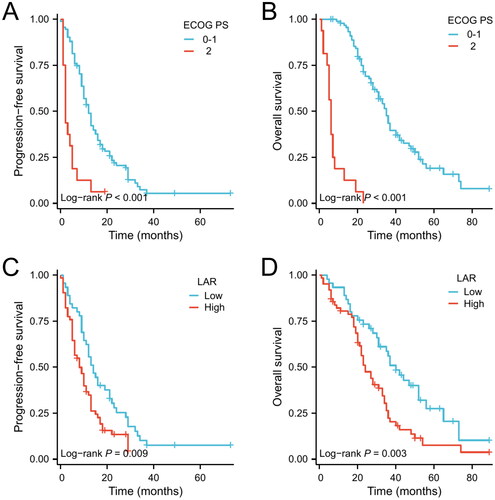
Table 2. Univariate and Multivariate Cox analysis for PFS in advanced EGFR-mutated NSCLC receiving EGFR-TKI monotherapy.
Table 3. Univariate and multivariate analysis for OS in advanced EGFR-mutated NSCLC receiving EGFR-TKI monotherapy.
Figure 3. Time-dependent ROC curves of LAPS score for predicting 1-, 2-, 3-years OS (A) and P1-, 2-, 3-years PFS (B).
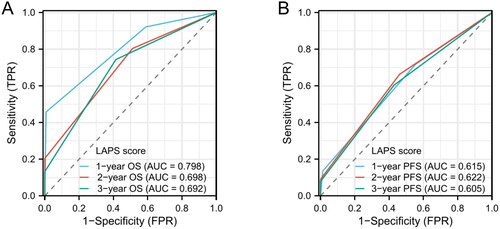
Figure 4. Clinical outcomes and efficacy analysis for EGFR-mutated advanced NSCLC receiving EGFR-TKI monotherapy in different risk groups. Kaplan–Meier curves for PFS (A) and OS (B); best response (C), ORR (D) and DCR (E).
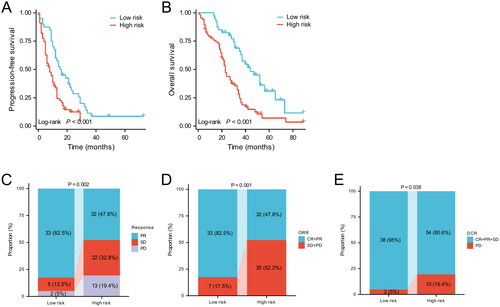
Table 4. Efficacy response of different treatment modalities according to LAPS score.
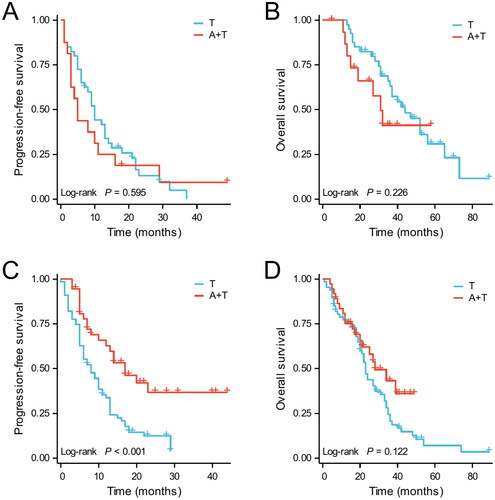
Figure 5. Kaplan-Meier curves of PFS (A) and OS (B) for patients who received EGFR-TKI with or without bevacizumab in low-risk groups. Kaplan–Meier curves of PFS (C) and OS (D) for patients who received EGFR-TKI with or without bevacizumab in high-risk groups.
Data availability statement
The data that support the findings of this study are available from the corresponding author upon reasonable request.