
Figures & data
Table 1. Patients’ baseline characteristics of the included patients
Figure 1. Overall survival curve for the entire study population.
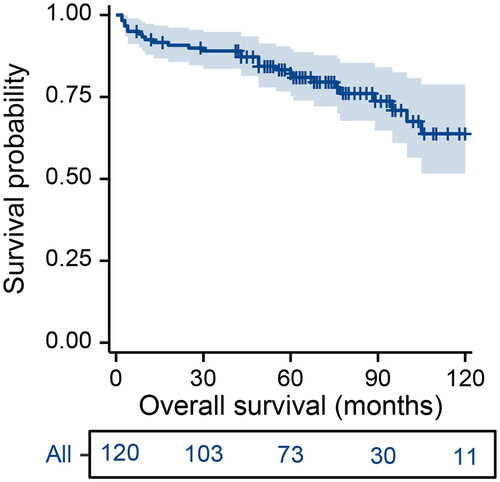
Figure 2. Construction and validation process of a decision tree model for predicting the overall survival of patients with T-cell large granular lymphocyte leukaemia. (A–B) Feature selection steps carried out using the lasso regression model; (C) Univariate and multivariate Cox regression analyses; (D) A simplified decision-tree model; (E) Kaplan-Meier survival curves of the three risk groups; (F) Time-dependent receiver operating characteristic curves displaying predictive accuracy for various timeframes (2-, 5-, and 10-year overall survival); (G) Calibration curves for the same three survival periods; and (H) A comparison of time-dependent AUC between the decision tree model and the nomogram model. HR: hazard ratio; CI: confidence interval; ECOG PS: Eastern Cooperative Oncology Group performance status; aCCI: age-adjusted Charlson Comorbidity Index; LGL: large granular lymphocyte; Int: intermediate; TPR: true positive rate; FPR: false positive rate; AUC: area under the curve.
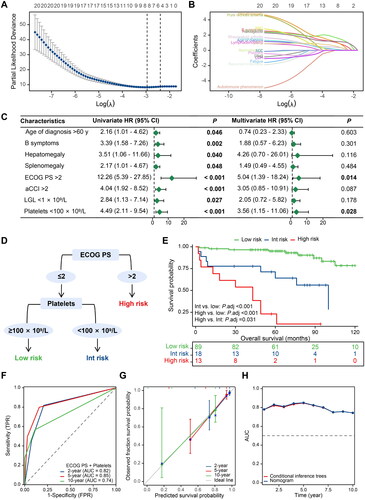
Figure 3. Correlation analysis of the correlation with performance status. ECOG PS: Eastern Cooperative Oncology Group performance status; aCCI: age-adjusted Charlson Comorbidity Index.
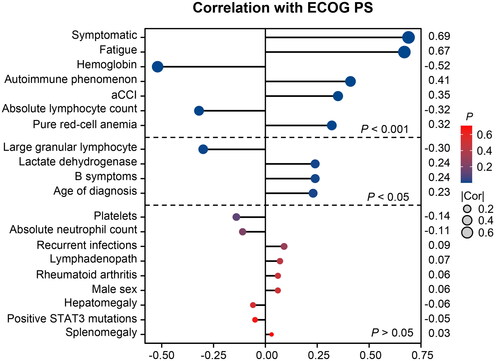
Table 2. Comparisons of baseline characteristics between different risk subgroups
Figure 4. Sankey plot Illustrating relationship and distribution between risk stratification and treatment. Int: intermediate; MTX: methotrexate; CTX: cyclophosphamide; CsA: cyclosporine; CR: complete remission; PR: partial remission.
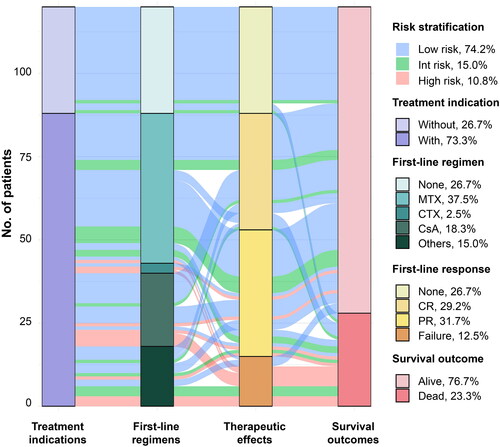
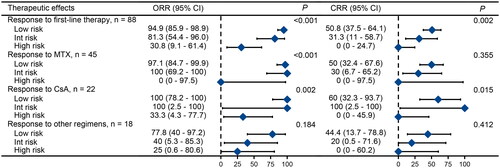
Figure 5. Treatment outcomes of different risk groups for first-line therapies. Note: Data for cyclophosphamide is not shown due to the limited number of cases. The other treatment regimens used were CHOP (cyclophosphamide + doxorubicin + vincristine + prednisone), EPOCH (etoposide + doxorubicin + cyclophosphamide + vincristine + prednisone), FC (fludarabine + cyclophosphamide), and so on. ORR: overall response rate; CI: confidence interval; CRR: complete remission rate; Int: intermediate; MTX: methotrexate; CsA: cyclosporine.
Supplemental Material
Download MS Word (451.4 KB)Data availability statement
The data generated in this study are available upon request from the corresponding author.