
Figures & data
Figure 1. Flow diagram of patient enrolment. Abbreviations: LT: liver transplantation; AKI: acute kidney injury.
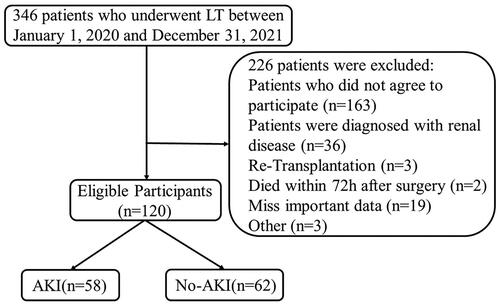
Table 1. Characteristics of study population.
Figure 2. Novel biomarkers for AKI after LT. (A) serum cystatin C concentration, (B) serum NGAL concentration, (C) serum endostatin concentration and (D) serum MIF concentration. Abbreviations: AKI: acute kidney injury; NGAL: neutrophil gelatinase-associated lipocalin; MIF: macrophage migration inhibition factor; PRE: preoperative; POS: postoperative. ns: not statistically significant, ***p-value < 0.001.
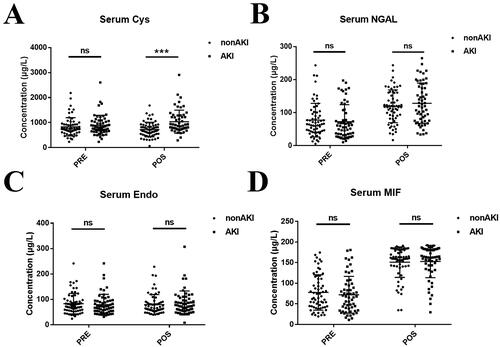
Figure 3. The forest plot of univariable logistic regression analysis for the predictors of AKI after LT. Abbreviations: OR: odds ratio; 95% CI (OR): 95% confidence interval of OR; TB: serum total bilirubin; ALT: alanine aminotransferase; AST: aspartate aminotransferase; EAD: early allograft dysfunction; ARDS: acute respiratory distress syndrome. *p-Value < 0.05.
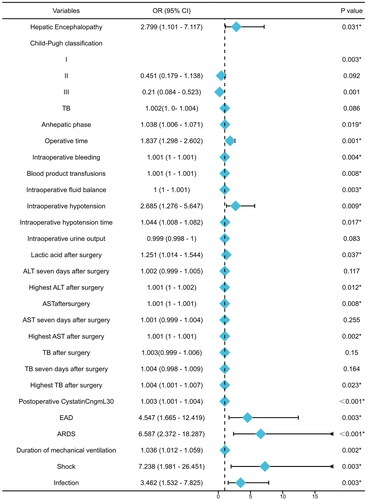
Figure 4. The ROC curves of two models and postoperative cystatin C level. (a) The model showing the area under the ROC curve (AUC) was 0.815 [95% CI: 0.737–0.894]. (b) Postoperative cystatin C level, AUC was 0.721 (95% CI: 0.629–0.813). (c) The model only with clinical factors, AUC was 0.770 (95% CI: 0.682–0.858). Abbreviations: TPR: true positive rate; FPR: false positive rate.
![Figure 4. The ROC curves of two models and postoperative cystatin C level. (a) The model showing the area under the ROC curve (AUC) was 0.815 [95% CI: 0.737–0.894]. (b) Postoperative cystatin C level, AUC was 0.721 (95% CI: 0.629–0.813). (c) The model only with clinical factors, AUC was 0.770 (95% CI: 0.682–0.858). Abbreviations: TPR: true positive rate; FPR: false positive rate.](/cms/asset/7219c41e-e9f6-4463-8ee5-2eefee4fc8b5/iann_a_2259410_f0004_c.jpg)
Table 2. Multivariate logistic regression model for the prediction of post-LT AKI.
Figure 5. Development of a nomogram for the prediction of post-LT AKI.
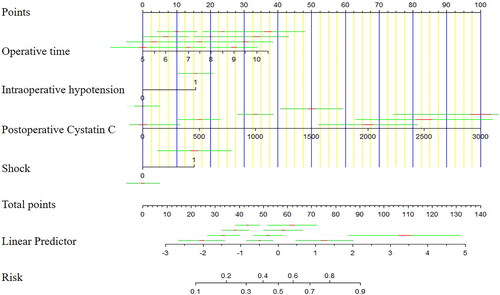
Figure 6. Decision curve analysis (A) and calibration curves (B) of the nomogram for the prediction of post-LT AKI.
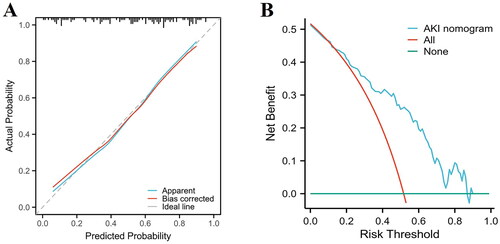
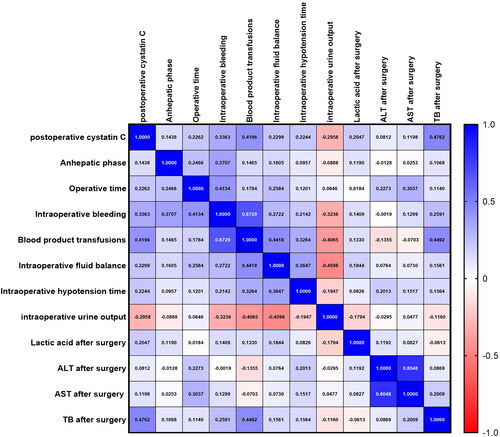
Figure 7. Correlation between postoperative cystatin C level, intraoperative parameters and postoperative laboratory results. The values are presented as Spearman’s r of 120 runners for operative cystatin C. Colormap with range between 1 and −1 and blue for the largest value and red for the smallest value. Abbreviations: ALT: alanine aminotransferase; AST: aspartate aminotransferase; TB: serum total bilirubin.
Supplemental Material
Download MS Word (319.4 KB)Data availability statement
The datasets used and/or analyzed during the current study are available from the corresponding author on reasonable request.