
Figures & data
Figure 1. Ultrasound imaging for thickness (A) and stiffness (B) measurements of the masseter muscle. White dashed line, maximal muscle thickness.
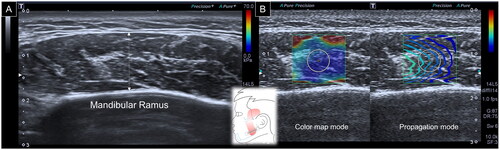
Figure 2. Ultrasound imaging for thickness (A) and stiffness (B) measurements of the temporalis muscle. White dashed line, maximal muscle thickness.
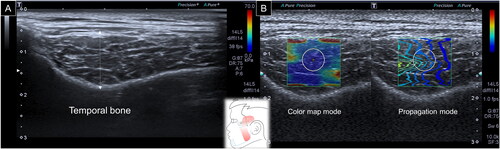
Figure 3. Ultrasound imaging for thickness (A) and stiffness (B) measurements of the temporalis muscle. White dashed line, maximal muscle thickness; LPM, lateral pterygoid muscle; CORP, coronoid process of the mandible.
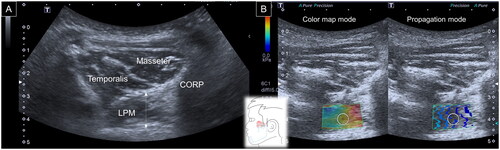
Table 1. Characteristics of the enrolled participants.
Table 2. Muscle thickness/stiffness in patients with unilateral orofacial pain.
Table 3. Comparative muscle thickness/stiffness values of the subjects.
Table 4. Associations between patient demographics and masticatory muscle thickness/stiffness values.
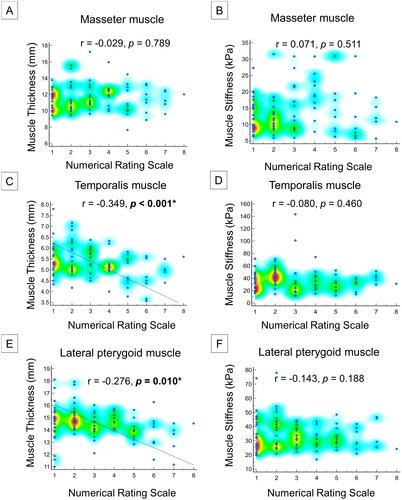
Figure 4. Correlations between muscle thickness/stiffness and numeric rating scale for masseter (A, B), temporalis (C, D) and lateral pterygoid (E, F) muscles.
Data availability statement
The datasets generated or analyzed during the study are available from the corresponding author on reasonable request.