
Figures & data
Figure 1. CONSORT flowchart of patient recruitment.
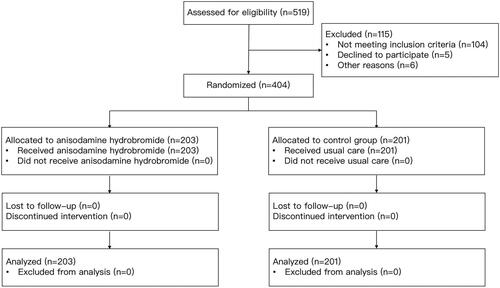
Table 1. Baseline characteristics in the treated and control groups.
Figure 2. Kaplan-Meier estimates of the probability of survival to day 28. The p value for the log-rank test is 0.026.
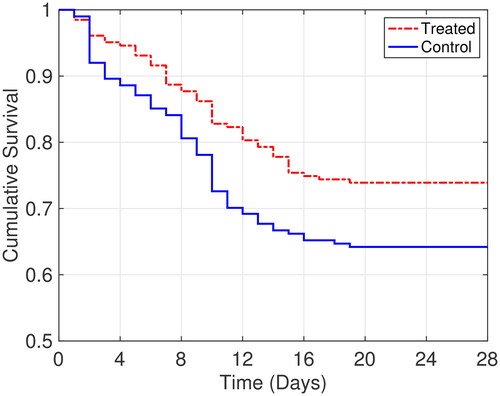
Table 2. Stratified analysis of 28-day mortality.
Table 3. Comparison of secondary clinical outcomes between the treated and control groups.
Figure 3. Comparisons of secondary outcomes between the treated and control groups. The error bar in (a)-(e) indicates the standard deviations. The box plots in (f) and (g) show the median, P25 and P75 (whiskers are at P5 and P95).
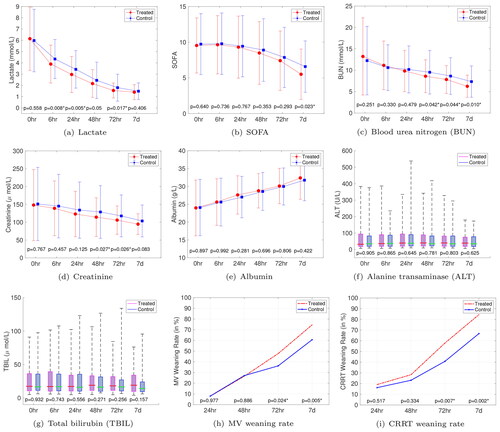
Table 4. Characteristics of the four adverse events in the treated group.
Availability of data and materials
The datasets used and/or analysed during the current study are available from the corresponding author on reasonable request.