
Figures & data
Table 1. Demographics of the subject in this study.
Table 2. Adverse events incidence after administration of TQA3526 by dose cohort (n = 74).
Figure 1. Mean (±SD) TQA3526 concentrations (ng/mL) versus time profiles (A) in the single ascending dose study and (B) the multiple dose study.
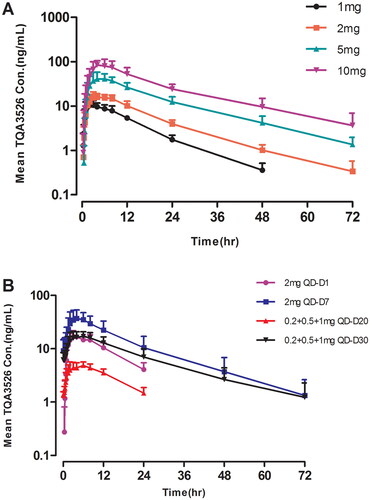
Table 3. Plasma pharmacokinetic parameters in the single ascending dose study.
Table 4. Plasma pharmacokinetic parameters in the multiple dose study.
Figure 2. Pharmacokinetic/pharmacodynamic profiles of FGF-19 for the single ascending dose study.
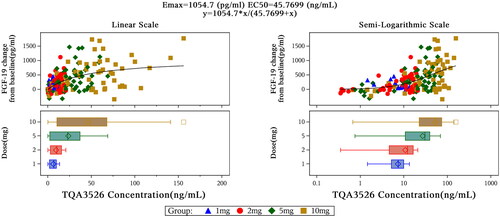
Figure 3. Mean (±SD) ALP (U/L), cholesterol (mmol/L), and bile acid (umol/L) concentrations versus time profiles in the single ascending dose study (A–C) and the multiple dose study (D–F).
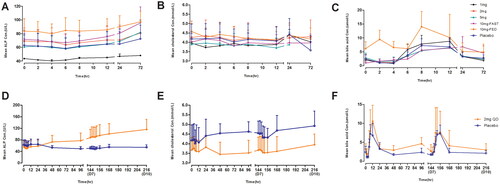
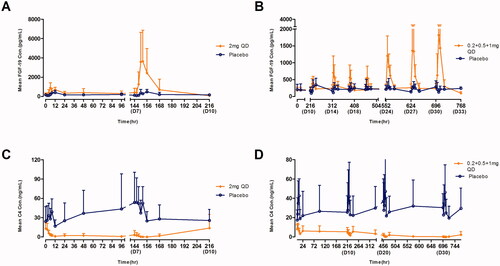
Figure 4. Mean (±SD) FGF-19 (pg/mL) and C4 (ng/mL) concentrations versus time profiles in the multiple dose study (A) FGF-19 for 2 mg cohort, (B) FGF-19 for 0.2 + 0.5 + 1 mg, (C) C4 for 2 mg cohort, and (D) C4 for 0.2 + 0.5 + 1 mg.
Data availability statement
Data are not available due to ethical restrictions.