
Figures & data
Figure 1. Flowchart of the study procedure.

Figure 2. Changes in flexibility.
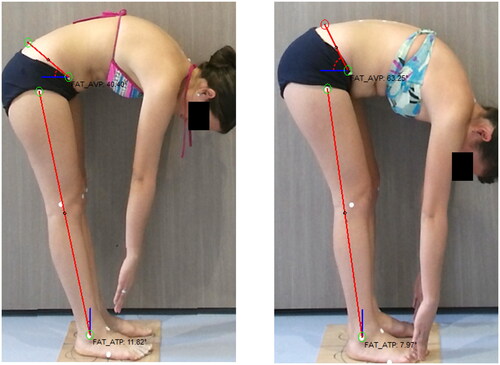
Table 1. Participant characteristics and baseline data.
Table 2. Results between group comparisons for pain, disability and QOL measures.
Table 3. Results of the between group comparisons for posture and flexibility.
Supplemental material
Supplemental Material
Download MS Word (1.4 MB)Data availability statement
The data availability is in the process of being published in the intellectum repository. If this information is required, please contact the author of the correspondence.