
Figures & data
Figure 1. Flow chart of the study population. Analysis was based on the ITT dataset.
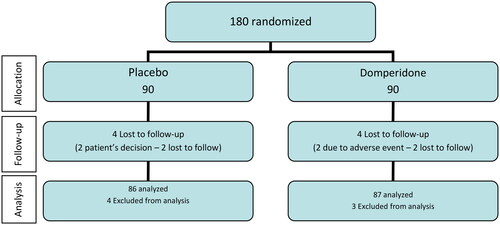
Table 1. Demographic, baseline physical exam and previous SARS-CoV-2 infection in the study groups.
Table 2. Symptoms observed at baseline: frequency and severity (0–10 points of a NRS) compared by study group.
Figure 2. Evolution of Ct values of ORF1ab, N Protein and S Protein at follow-up in the two study groups.
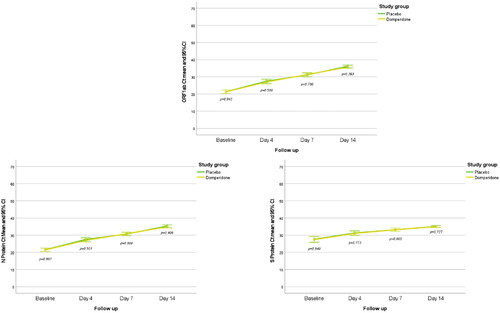
Figure 3. Kaplan–Meier curves for the median time to obtain an RT-qPCR negative result by study group.
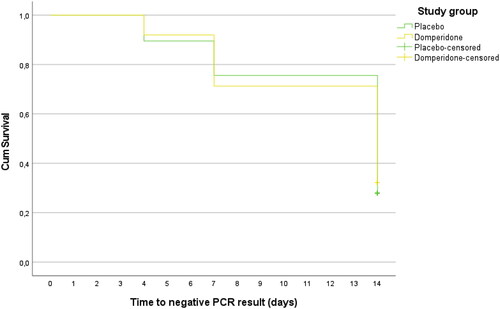
Table 3. Persistent symptoms observed after 28 days of follow-up by study groups.
Data availability statement
The datasets used and analysed during the current study are available from the corresponding authors upon reasonable request.