
Figures & data
Figure 1. ZNF281 promotes CRC cell radioresistance. (A) Positive ZNF281 expression in a representative biopsy specimen from a patient who exhibited resistance to PRT (×200). (B) Negative ZNF281 expression in a representative biopsy specimen from a patient who exhibited sensitivity to PRT (×200). (C) Positive ZNF281 expression in a representative biopsy specimen with poor tumor regression grade (TRG ≤ 2) (×200). (D) Negative ZNF281 expression in a representative biopsy specimen with good tumor regression grade (TRG ≥ 3) (×200). (E) Kaplan–Meier curves of DFS in our cohort. (F) Kaplan–Meier curves of OS in our cohort. (G) ZNF281 levels in different subgroups (responder, respond to radiation; nonresponder, no response to radiation). (H) Kaplan–Meier curves of OS in GSE133057 dataset. (*p < 0.05; **p < 0.01).
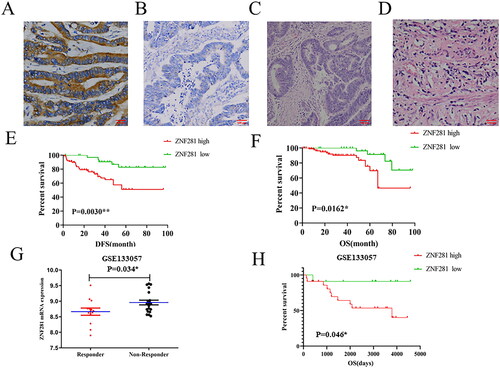
Table 1. Chi-square test of clinicopathologic characteristics and ZNF281 mRNA expression in our cohort.
Table 2. Univariate and multivariate Cox regression analysis of clinical pathologic features according to our cohort.
Figure 2. ZNF281 was identified as an anti-radiation factor that improved the survival of CRC cells irradiated by X-rays. (A) Verification of ShRNA efficiency for ZNF281 knockdown by Western blot analysis. (B) Verification of ShRNA efficiency for ZNF281 knockdown by RT-PCR. (C) Colony formation assay was used to assess the survival of CRC cells after 8 days of exposure to X-rays (Vector, lentiviral vector; ShZNF281, ZNF281 after stable knockdown).
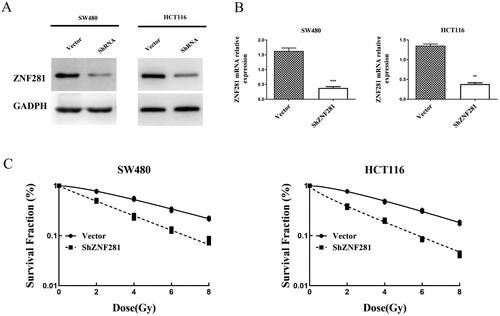
Figure 3. ZNF281 promotes radiation resistance by promoting DSB repair in CRC cells. (A) Immunofluorescence images of γH2AX levels and time course of lesion changes in X-ray-treated CRC cells (×400). (B) The foci number in CRC cells (mean ± SD). (C) The effects of ZNF281 on γH2AX levels in CRC cells treated with X-rays (loading control: GAPDH. Vector, lentiviral vector; ShZNF281, ZNF281 after stable knockdown; ***, p < 0.01).
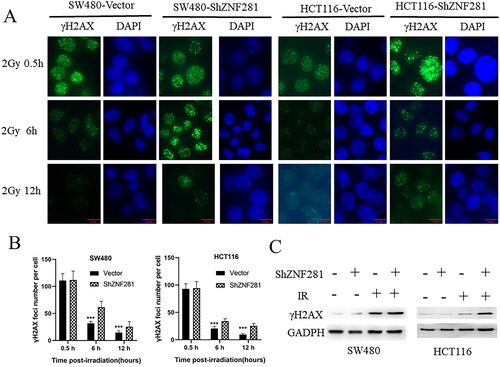
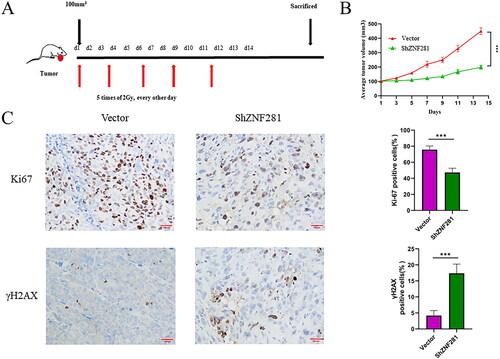
Figure 4. ZNF281 promotes the resistance of CRC cells in a nude mouse model (A) HCT116 cells transfected with ZNF281 low expression (ShZNF281) and vector (vector) to establish transplanted xenografts were treated with X-rays (2 Gy/day) for 14 days. (B) Tumour volumes measured at different time points. (C) Images of IHC staining of Ki67 and γH2AX in xenografts (×200). (***, p < 0.001; vector, lentiviral vector; ShZNF281, ZNF281 after stable knockdown).
Availability of data and materials
The data used to support the findings of this study are included within the article.