
Figures & data
Figure 1. Survival curves according to the cutoff levels of baseline SII, NLR, PLR, LCR, and LMR determined by X-tile.
(A) Significant difference in PFS between patients with baseline SII higher than 947.82 and those with SII lower than 947.82 (6.27 months vs 11.43 months, P < 0.001) in the training cohort.
(B) Significant difference in PFS between patients with baseline NLR lower than 3.17 and those with NLR higher than 3.17 (11.43 months vs 6.3 months, P = 0.0014) in the training cohort.
(C) Significant difference in PFS between patients with baseline PLR lower than 253.52 and those with PLR higher than 253.52 (9.5 months vs 6.1 months, P = 0.0335) in the training cohort.
(D) Significant difference in PFS between patients with baseline LCR higher than 0.03 and those with LCR lower than 0.03 (9.6 months vs 3.95 months, P = 0.0009) in the training cohort.
(E) Significant difference in PFS between patients with baseline LMR higher than 1.34 and those with LMR lower than 1.34 (9.4 months vs 1.78 months, P < 0.001) in the training cohort.
(F) Significant difference in PFS between patients with baseline SII higher than 947.82 and those with SII lower than 947.82 (8.17 months vs 17.9 months, P = 0.0423) in the validation cohort.
(G) Significant difference in PFS between patients with baseline NLR lower than 3.17 and those with NLR higher than 3.17 (17.9 months vs 12.6 months, P = 0.016) in the validation cohort.
(H) Significant difference in PFS between patients with baseline PLR lower than 253.52 and those with PLR higher than 253.52 (16.97 months vs 10.67 months, P = 0.0476) in the validation cohort.
(I) Significant difference in PFS between patients with baseline LCR higher than 0.03 and those with LCR lower than 0.03 (17 months vs 8.17 months, P = 0.0456) in the validation cohort.
(J) Significant difference in PFS between patients with baseline LMR higher than 1.34 and those with LMR lower than 1.34 (17.73 months vs 8.17 months, P = 0.0178) in the validation cohort.
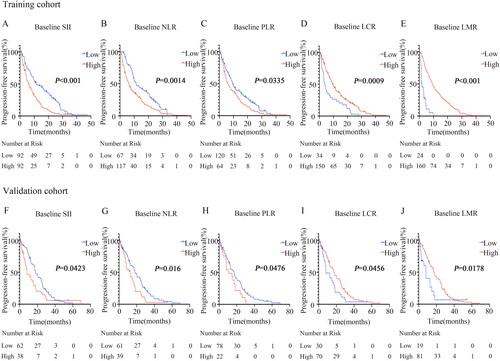
Figure 2. Survival curves according to fluctuations in SII, NLR, and LMR levels.
(A) Significant difference in SII between patients with SII elevation and those with SII reduction after receiving immunotherapy compared to the baseline (7.13 months vs 11.27 months, P = 0.0416) in the training cohort.
(B) Significant difference in NLR between patients with NLR elevation and those with NLR reduction after receiving immunotherapy compared to the baseline (6.93 months vs 11.07 months, P = 0.0412) in the training cohort.
(C) Significant difference in LMR between patients with LMR elevation and those with LMR reduction after receiving immunotherapy compared to the baseline (13.3 months vs 7.1 months, P = 0.0128) in the training cohort.
(D) Significant difference in SII between patients with SII elevation and those with SII reduction after receiving immunotherapy compared to the baseline (12.63 months vs 23.5 months, P = 0.0435) in the validation cohort.
(E) Significant difference in NLR between patients with NLR elevation and those with NLR reduction after receiving immunotherapy compared to the baseline (12.6 months vs 17 months, P = 0.0399) in the validation cohort.
(F) Significant difference in LMR between patients with LMR elevation and those with LMR reduction after receiving immunotherapy compared to the baseline (17.73 months vs 8.77 months, P = 0.005) in the validation cohort.
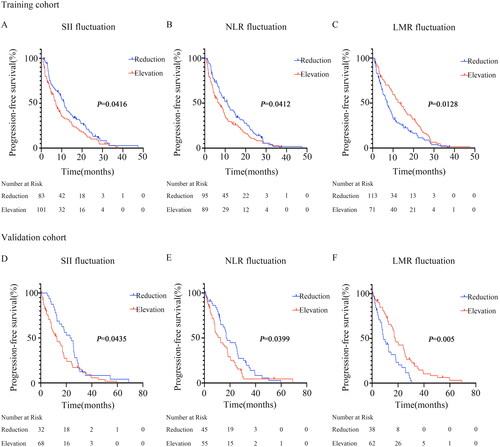
Table 2. Predictive factors for PFS by univariate analysis.
Table 3. Predictive factors for PFS by multivariate analysis.
Table 1. The impact of baseline inflammation-related indications and dynamic changes for PFS.
Supplemental Material
Download MS Word (274 KB)Data availability statement
The data generated and analyzed is available from the corresponding author upon reasonable request. The authenticity of this article has been validated with key raw data uploaded onto the Research Data Deposit (RDD) public platform (https://www.researchdata.org.cn). The approval RDD number is RDDA2023623285.