
Figures & data
Table 1. The baseline demographic characteristics of all patients.
Figure 1. The cluster heatmap plot of all 523 identified CNVs in each cancer.
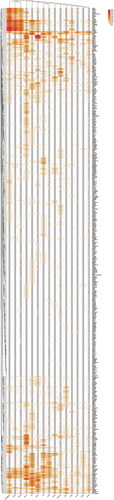
Figure 2. The Venn plot of identified common CNVs and cancer-specific CNVs.
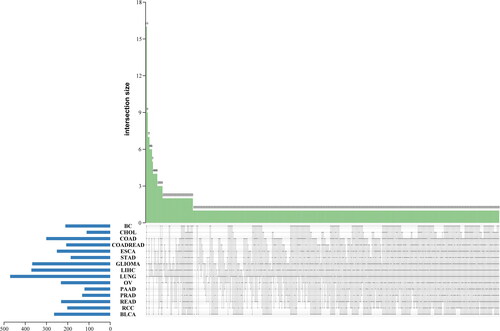
Figure 3. The heatmap plot of GSEA analysis of identified CNVs.
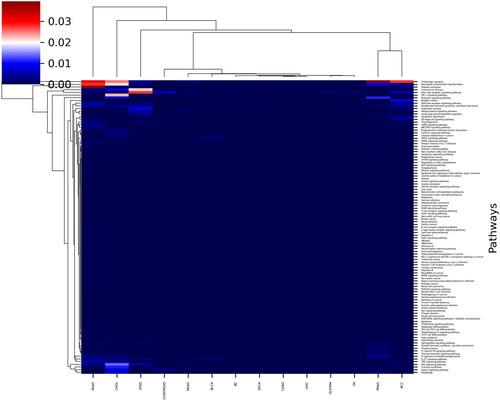
Figure 4. The Venn plot of common CNVs in two clusters after cluster analysis: (A) the Venn plot of commonly identified CNVs in COAD and READ; (B) the Venn plot of commonly identified CNVs in CHOL and LUNG.
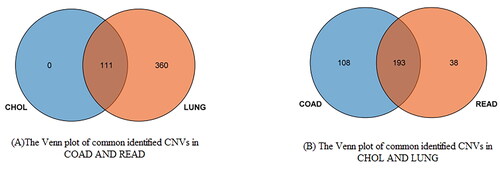
Figure 5. The correlation matrix between every pair of cancers.
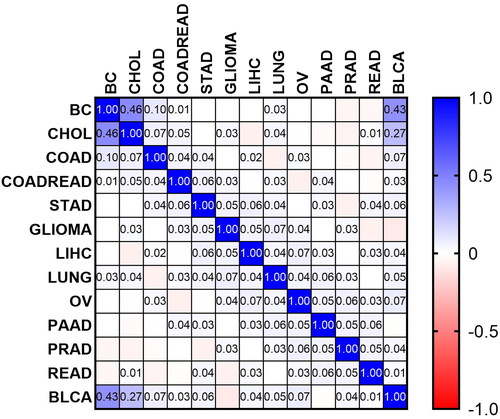
Figure 6. The visual results of GO and KEGG analysis of identified common CNVs. (A) The GO analysis of identified common CNVs; (B) the KEGG analysis of identified common CNVs.
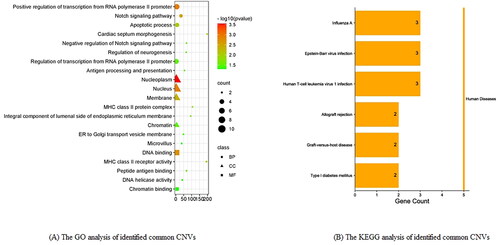
Table 2. The association of age, sex, cancer type and the frequency of FAM58A.
Figure 7. The coefficients of each feature for differentiation between 15 types of cancers.
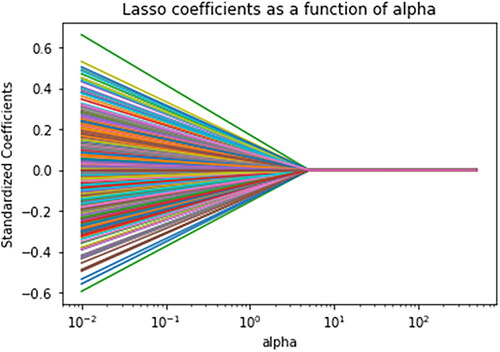
Table 3. Summary of the coefficients of important features for differentiation between 15 cancer types.
Supplemental Material
Download MS Excel (127.4 KB)Data availability statement
The data that support the findings of this study are available from the corresponding author.