
Figures & data
Figure 1. Study profile.
A total of 68 patients were screened. Among those, 1 patient was excluded with an age of less than 18; 2 in combination with other drugs (except glucocorticoids); 3 with incomplete data; 4 with anaemia in chronic kidney disease or other types of anaemia; 3 discontinued sirolimus due to uncontrolled infection or tumour recurrence (treated with sirolimus for less than 6 months); 11 lost during the first 12 months of follow-up (7 lost with less than 3 months of follow-up, and 4 lost with 3–6 months of follow-up). The remaining 44 patients all have been treated with sirolimus for at least 6 months and followed up for at least 12 months.
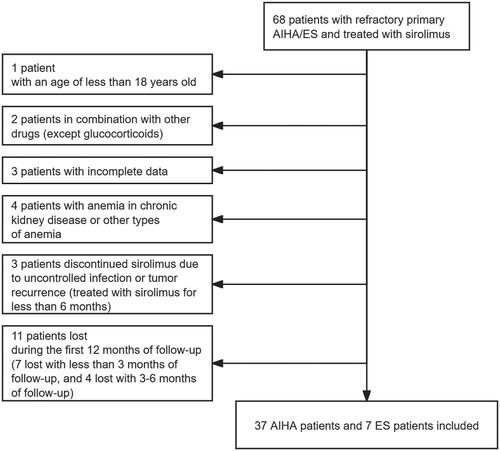
Figure 2. Sirolimus plasma trough concentration in patients with response or no response to sirolimus. A line chart was conducted to assess intraindividual variability of sirolimus plasma trough concentration in each patient. One patient did not have a sirolimus plasma concentration test during the administration of sirolimus.
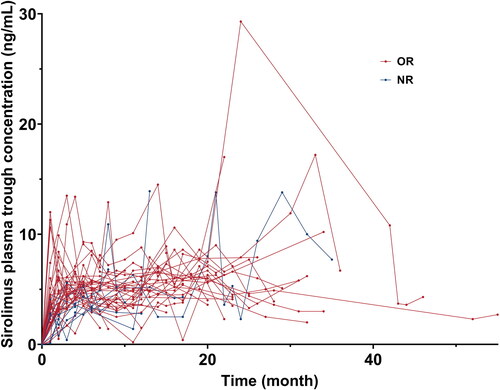
Table 1. Baseline characteristics.
Figure 3. Cumulative response rate and response rate at 3, 6, 12 months, and at the end of follow-up. A. The cumulative or rate curves. Patients who did not respond to sirolimus were censored at the end of follow-up. B. The cumulative CR rate curves. Patients who did not respond to sirolimus were censored at the end of follow-up. C. The efficacy of sirolimus at 3, 6, 12 months of treatment and at the end of follow-up.
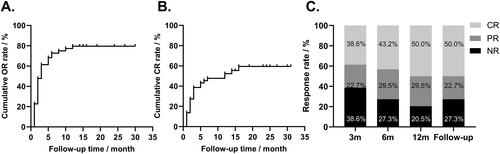
Table 2. Response to sirolimus.
Figure 4. Key laboratory parameter changes at 3, 6, 12 months, and at the end of follow-up. A. The haemoglobin levels at baseline, 3, 6, 12 months of treatment, and at the end of follow-up. The haemoglobin levels at 3, 6, 12 months, and at the end of follow-up were significantly higher than the baseline level (all p <0.001). B. The absolute reticulocyte counts at baseline, 3, 6, 12 months of treatment, and at the end of follow-up. The absolute reticulocyte counts at 12 months and at the end of follow-up were significantly lower than the baseline level (p = 0.005 and p < 0.001, respectively). C. The lactate dehydrogenase levels at baseline, 3, 6, 12 months of treatment, and at the end of follow-up. The lactate dehydrogenase levels at 12 months and at the end of follow-up were significantly lower than the baseline level (p = 0.006 and 0.036, respectively). D. The serum total bilirubin levels at baseline, 3, 6, 12 months, and at the end of follow-up. The serum total bilirubin levels at 3, 6, 12 months, and at the end of follow-up were significantly lower than the baseline (all p <0.001). E. The serum indirect bilirubin levels at baseline, 3, 6, 12 months, and at the end of follow-up. The serum indirect bilirubin levels at 3, 6, 12 months, and at the end of follow-up were significantly lower than the baseline level (all p <0.001). F. The platelet levels at baseline, 3, 6, 12 months of treatment, and at the end of follow-up. The platelet levels at 3 and 12 months were significantly higher than the baseline level (p = 0.037, 0.029, respectively), and there was a trend that the platelet levels at 6 months and at the end of follow-up were higher than the baseline level (p = 0.058, 0.055, respectively). In panels A-E, the horizontal line within each box represented the median, the lower and upper borders of each box represented the 25th and the 75th percentiles, respectively, and the I bars represented the adjusted minimum and maximum range. Dots represented outlier values.
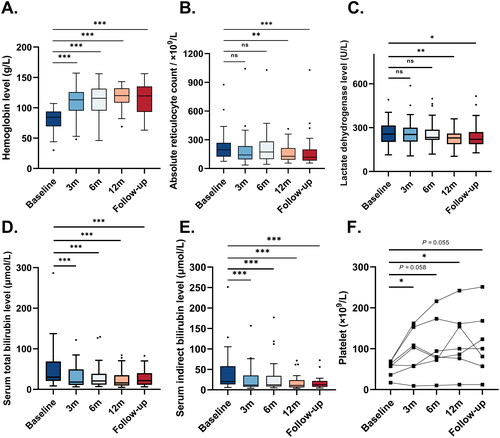
Table 3. Adverse events during the treatment period.
Figure 5. Relapse-free survival of sirolimus treatment. A. The relapse-free survival of 35 patients with response to sirolimus. The solid line represented relapse-free survival during treatment, and the dotted line represented the 95% CI range. B. Relapse-free survival in patients refractory or relapsed. The blue line represented relapse-free survival in refractory patients, and the red line represented relapse-free survival in relapsed patients. Patients who did not relapse were censored at the end of follow-up.
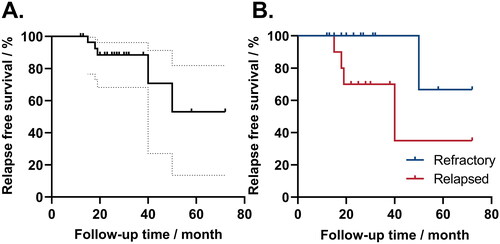
Table 4. Factors that may affect or/CR/relapse.
Table 5. Previous studies about sirolimus in patients with refractory primary AIHA/ES.
Data availability statement
The datasets are not publicly available due to personal data protection reasons but are available from the corresponding author upon reasonable request.