
Figures & data
Figure 1. (A) The Venn diagram of overlapping targets of C. ramulus and as. Note: green areas represent drug targets, and red areas represent disease targets. (B, C) PPI network diagrams of the overlapping targets. (D) PPI network diagram of the hub targets.
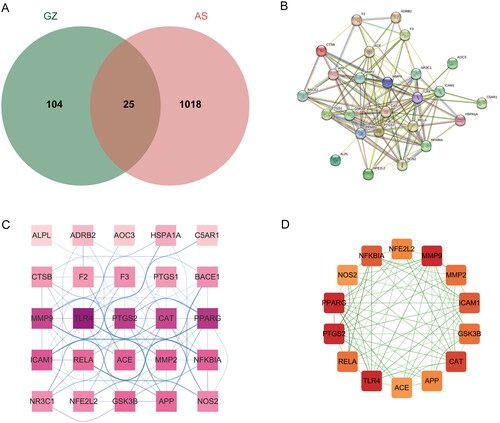
Figure 2. (A) Compound-overlapping target network diagram. Note: red squares represent overlapping targets, and green circles represent active compounds. (B) Pathway-hub target network diagram. Note: brown hexagons represent pathways, and purple circles represent hub targets. (C) Herb-compound-hub target-pathway-disease network diagram. Note: purple V-shape represents disease, yellow triangle represents herb, red squares represent hub targets, blue circles represent compounds, and green diamonds represent pathways.
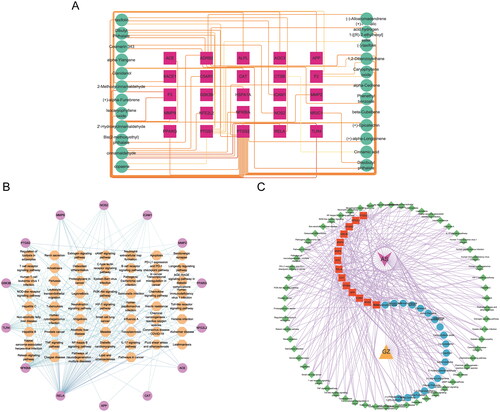
Table 1. Physiochemical properties, PubChem CID, 2D structure, and degree of core compounds.
Figure 3. (A) Top 10 GO terms of overlapping genes. (B) Top 20 enriched KEGG pathways of overlapping genes.
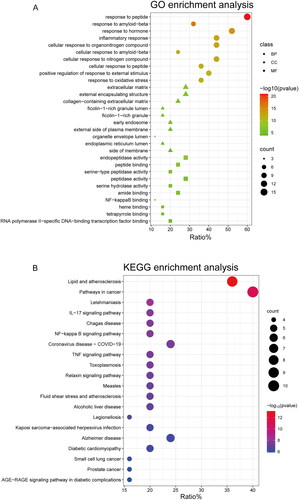
Figure 4. Molecular docking results of core compounds of C. ramulus: (A) 2-Methoxycinnamaldehyde - TLR4 (B) cinnamaldehyde - PTGS2 (C) cinnamaldehyde - TLR4 (D) 2-Hydroxycinnamaldehyde - MMP9.
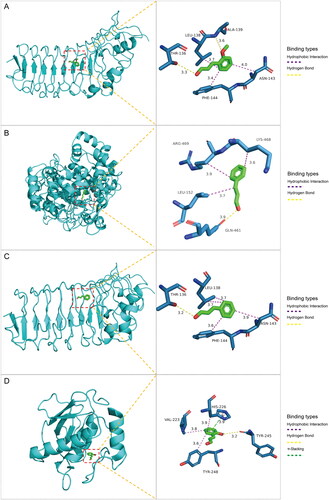
Table 2. Binding energy of core compounds and core targets.
Figure 5. Immunohistochemical staining analysis. (A, B, D, E, G, H) show the specific expression of PTGS2, TLR4, MMP9 in the as group and the control group. (C, F, I) show the statistical analysis results of the positivity rate between the as group and the control group.
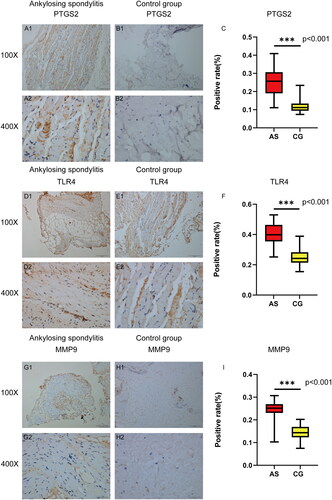
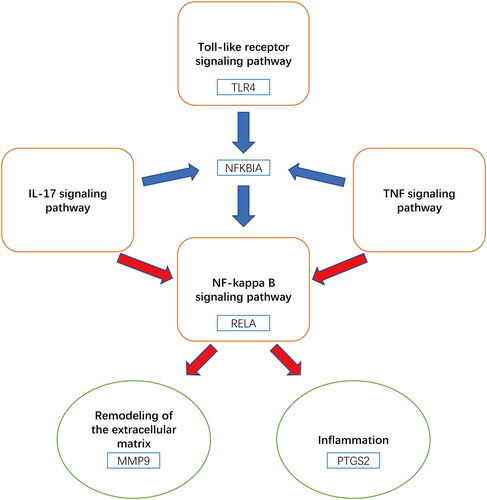
Figure 6. Core targets and potential mechanism of key compounds in C. ramulus against as.
Supplemental Material
Download MS Word (21.2 KB)Data availability statement
All data collected in the present work are obtained from public databases, and part of the data are presented in Supplementary material.