
Figures & data
Figure 1. Surgical schematic of PNS implantation and PRF placement. (a) Anteroposterior view of fluoroscopic imaging. Red cycle indicated the foramen ovale; blue line indicated the mandibula; (b) depth of PRF cannulation was guided under the lateral view of the fluoroscopy.
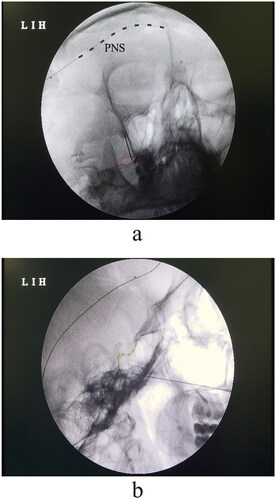
Table 1. General characteristics of patients.
Figure 2. Pain severity assessed by the visual analogue score at each follow-up point. Patients were interviewed at baseline, discharge, 1-, 3-, 6- and 12 months after neuromodulation treatment. Two-way analysis of variance with repeated measures and Bonferroni’s post-test. ns = non-significant, *p < .05, **p < .01, ****p < .0001.
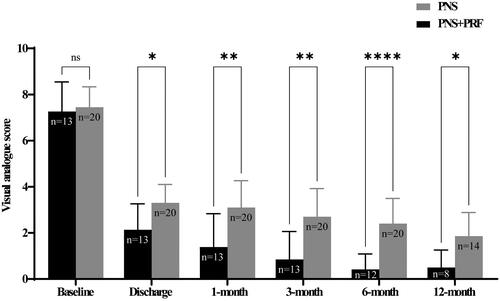
Table 2. Summary of enrolled literatures..
Data availability statement
The authors confirm that the data supporting the findings of this study are available within the article.