
Figures & data
Table 1. Overview of included prediction models.
Table 2. Characteristics of the study sample.
Figure 1. Receiver operating characteristics (ROC) curves for predicting 31-day mortality.
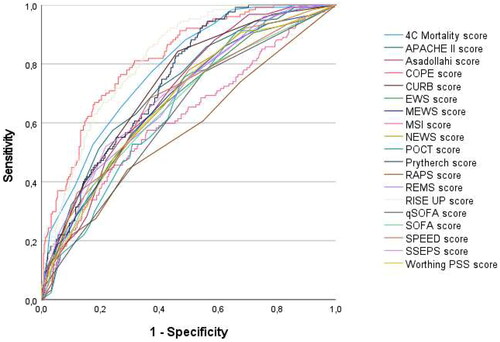
Figure 2. Calibration plots of the predicted 31-day mortality (x axis) using the RISE UP score (left panel) and the COPE score (right panel). the RISE UP score shows excellent calibration. The COPE score is also well calibrated, but shows average underestimation of 31- day mortality and a slope of >1.
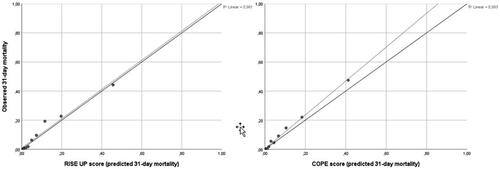
Table 3. Comparison of discriminatory performance of the included prediction models.
Table 4. Comparison of discriminatory performance of the included prediction models in 1-day and 7-day mortality.
Table 5. Cut off values of the RISE UP and COPE score and prognostic accuracy for 31-day mortality.
Table 6. Cut-off values of the RISE UP and COPE score and prognostic accuracy for 31-day mortality or ICU admission.
Supplemental Material
Download MS Word (141 KB)Data availability statement
Additional data are available upon reasonable request.