
Figures & data
Table 1. Smear and culture status and disease severity in patients with MDR-TB and DS-PTB.
Table 2. Demographic details and comparison of daily nutrient intake and weekly sunlight exposure in MDR-TB and DS-PTB patients with healthy controls.
Figure 1. Comparison of serum vitamin D levels during seasonal variations among different study groups. Box plot showing median (line), interquartile range (boxes), and 25% to 75% percentile (whiskers): HC, healthy controls; MDR, multi-drug resistant tuberculosis, PTB Cat I, pulmonary tuberculosis Category I; Seasons (Winter-December, January, Febuary; Summer-March, April and May; Monsoon- June, July, August and September; Post Monsoon- October, November.
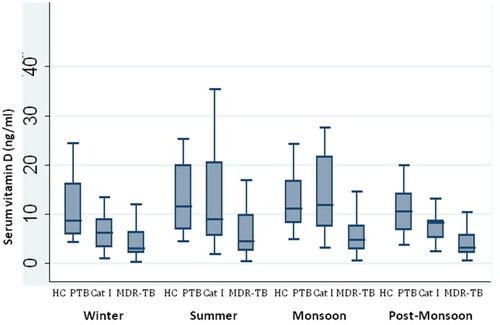
Figure 2. Overall comparison of serum vitamin D levels by seasons. Box plot showing median (line), interquartile range (boxes), and 25% to 75% percentile (whiskers); Seasons (Winter-December, January, Febuary; Summer-March, April and May; Monsoon- June, July, August and September; Post Monsoon- October, November) *p-value as compared to winter; #p-value as compared to Summer; @p-value monsoon vs post monsoon; Statistical method- Kruskal-Wallis Test (p < 0.05)and multiple comparision by Wilcoxon ranksum with Bonferroni correction (p < 0.08) were considered statistically significant.
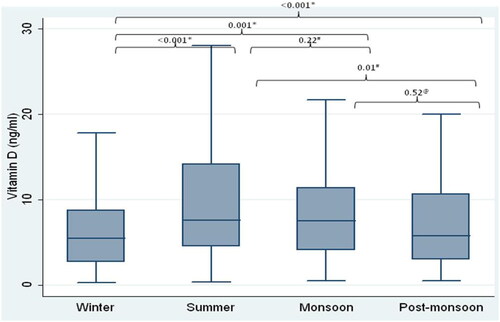
Table 3. Baseline biochemical parameters of study groups.
Figure 3. Correlation of serum vitamin D levels with dietary vitamin D in MDR-TB, PTB Cat I and healthy controls. Scatter plot are shown between dietary vitamin D (μg/d) in X-axis and serum vitamin D levels (ng/ml)) in Y axis with correlation ccoefficient (r) and significance of correlation (p).
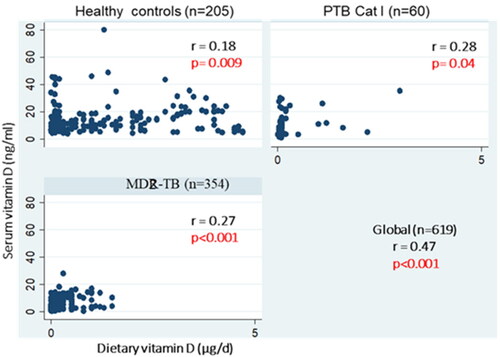
Table 4. Correlation of dietary vitamin D with other parameters in MDR-TB, DS-PTB and healthy controls.
Table 5. Correlation of serum vitamin D with other parameters in all three groups.
Table 6. Association of study parameters with severe vitamin D deficiency in patients and healthy controls (univariate analysis).
Table 7. Association of diet calcium and sun exposure with severe vitamin D deficiency in study participants (multivariate analysis).
Supplemental Material
Download MS Word (12.6 KB)Data availability statement
The data that support the findings of this study are available from the corresponding author, [Dr Jaishriram Rathored], upon reasonable request.