
Figures & data
Figure 1. A Crossover research design. Top and bottom figure is study arm #1 and arm #2, respectively.
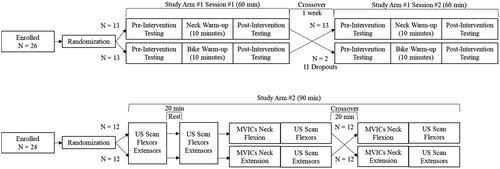
Table 1. Demographics.
Figure 2. Neck force raw data before (pre) and after (post) neck warm-up. Higher rate of force development was observed while the peak force was mostly unchanged. Visual-motor reaction time was calculated as the time for the force >5 Newtons.
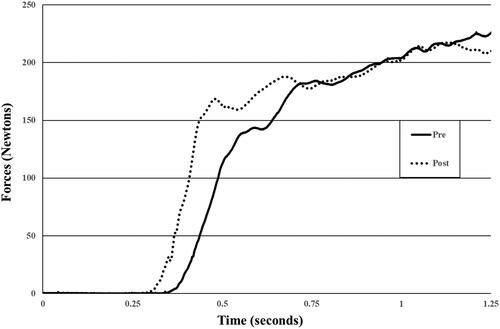
Figure 3. Force steadiness trials with visual feedback trial (force is flat and steady around 15 Newtons) and without visual feedback (force is overshot and gradual declines). force replication sense error was calculated as the average force output difference between two conditions during the Middle 8 s.
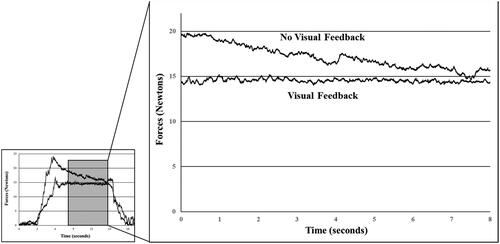
Figure 4. Ultrasound images: A. the sternocleidomastoid thickness and the longus colli cross-sectional area (CSA); B. the sternocleidomastoid shear wave elastography (SWE); C. the upper trapezius thickness and shear wave elastography; and D. the cervical extensors (EXT) thickness.
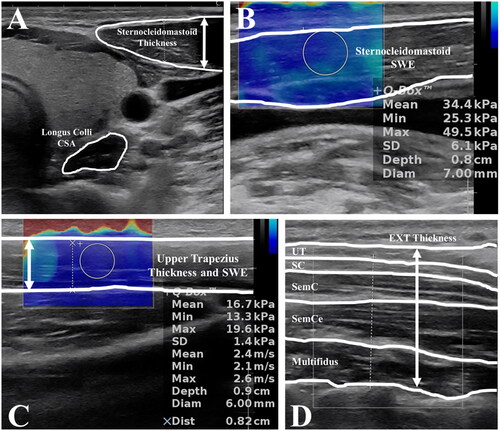
Table 2. Peak force (PF), visual-motor reaction time (VMRT), and rate of force development (RFD) values in the directions of flexion (flex), extension (ext), and right/left lateral flexions (right and left) before (PRE) and after (POST) neck warm-up and sham warm-up.
Table 3. Cervical flexion muscular force output and steadiness (coefficient of variation: CoV) with the visual feedback condition (VF) and without visual feedback condition (NoVF), absolute force replication error between force out under VF and NoVF conditions, cervical range-of-motion (ROM) before (PRE) and after (POST) neck warm-up with isometric contractions and sham warm-up.
Table 4. Ultrasound-based neck muscle morphological properties: cross-sectional area (CSA), thickness, and/or shear wave elastography (SWE) of the longus collis (LC), sternocleidomastoid (SCM), upper trapezius (up), and the cervical extensors (EXT) at sham (20-minute rest), before (PRE) and after (POST) the maximum voluntary isometric contractions.
Data availability statement
Data are available upon reasonable request.