
Figures & data
Figure 1. An image of the EPT procedure with the intact cord and the placenta attached.
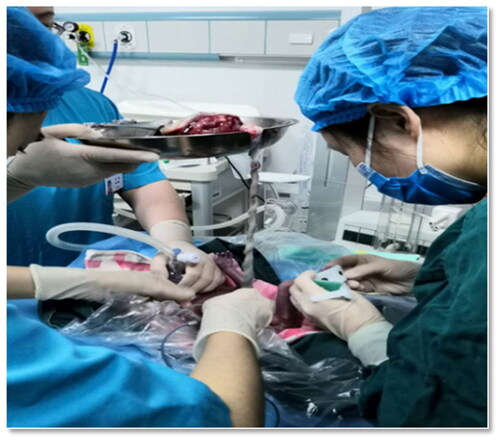
Figure 2. A flow diagram showing the patient recruitment protocol used in this study.
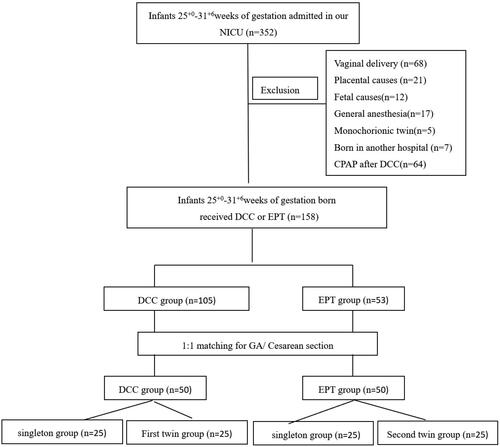
Table 1. The maternal demographics of the subjects in this study.
Table 2. The neonatal demographics and delivery room outcomes of the infants in this study.
Table 3. The neonatal outcomes of the infants in this study.
Figure 3. (A) Heart rate. All the presented data were based on all matched pairs n = 50. (B) Oxygen saturation. data of infants who were subjected to either DCC or EPT were calculated based on n = 12 at t = 1min, n = 34 at t = 2 min, n = 49 at t = 3 min, respectively. All the other presented data were based on n = 50. (C) Heart rate. The presented data were based on all the twins recruited, n = 25. (D) Oxygen saturation. The data on infants who were subjected to either DCC or EPT were calculated based on n = 2 at t = 1min, n = 11 at t = 2 min and n = 24 at t = 3 min, respectively. All the other presented data were based on n = 25.
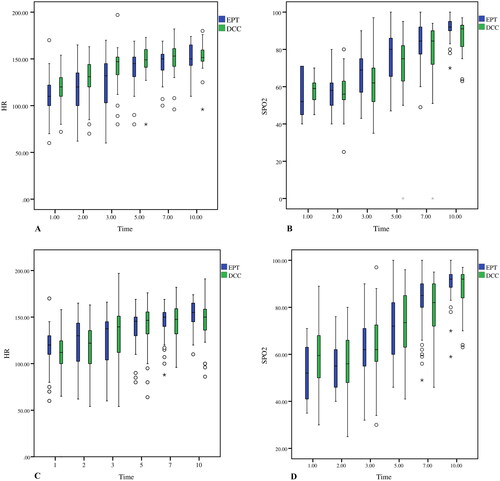
Table 4. The heart rate during transition of the infants.
Table 5. Oxygen saturation during transition of the infants.
Data availability statement
The datasets generated during the current study are available from the corresponding author on reasonable request.