
Figures & data
Table 1. Age distribution, HPV and CIN prevalence.
Figure 1. Age-specific prevalence of HPV infection. Panel A – age-specific prevalence of HPV infection; panel B – age-specific prevalence of single HPV infection; panel C – age-specific prevalence of multiple HPV infections.
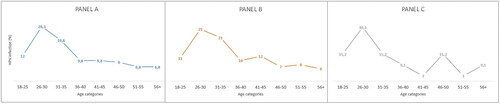
Table 2. Association of HR-HPV infection and abnormal cervical cytology.
Table 3. Prevalence of HPV types stratified by the cervical cytology result.
Supplemental material
Supplemental Material
Download MS Word (24.6 KB)Data availability statement
The study questionnaires and raw data are available from the project PI via email: [email protected]