
Figures & data
Table 1. Baseline characteristics of the recruited subjects.
Table 2. Correlation between Ca/P/Mg status and WBC/ESR/PLT/PCT in cases with respiratory diseases.
Figure 1. Differences of serum Ca level between various FRTI groups and controls.
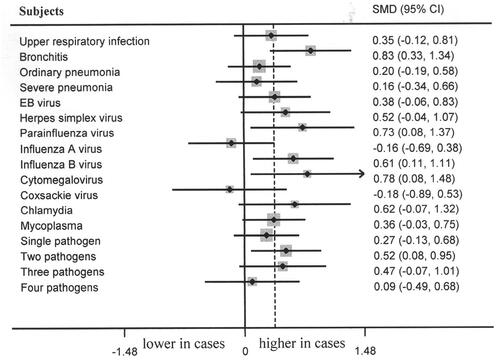
Figure 2. Differences of serum P level between various FRTI groups and controls.
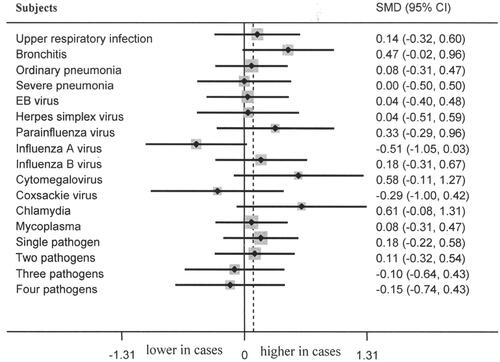
Figure 3. Differences of serum Mg level between various FRTI groups and controls.
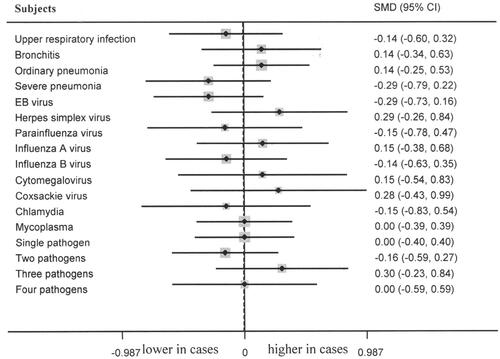
Figure 4. Serum Ca status among different participant groups (Ca status: mmol/L).
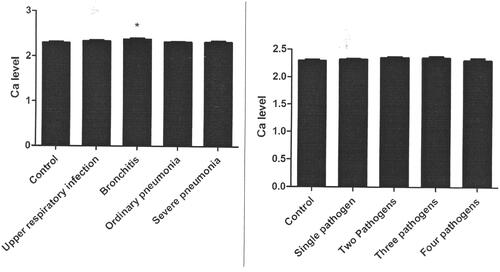
Table 3. Characteristics of Ca/P/Mg levels in respiratory .diseas es.
Figure 5. Serum Ca level ROC curve for bronchitis (AUC = 0.282).
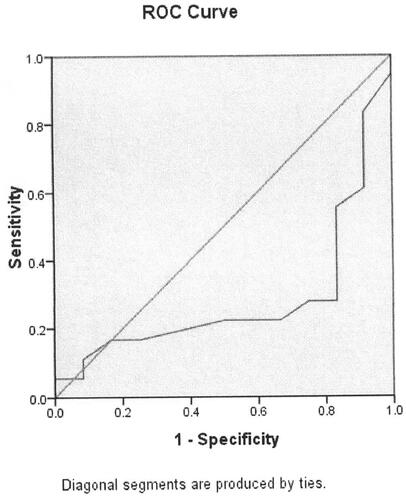
Figure 6. Serum Ca level ROC curve for parainfluenza virus infection (AUC = 0.310).
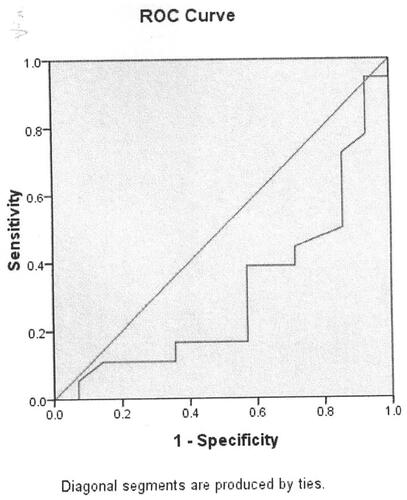
Figure 7. Serum Ca level ROC curve for influenza B virus infection (AUC = 0.330).
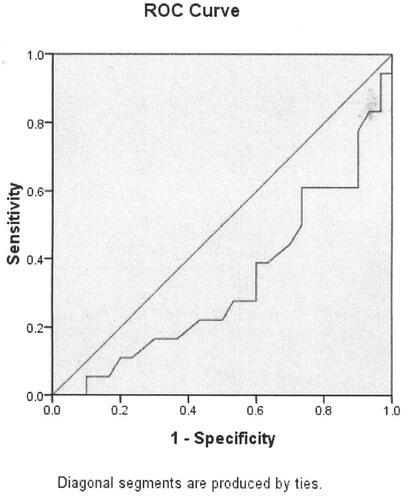
Figure 8. Serum Ca level ROC curve for cytomegalovirus infection (AUC = 0.312).
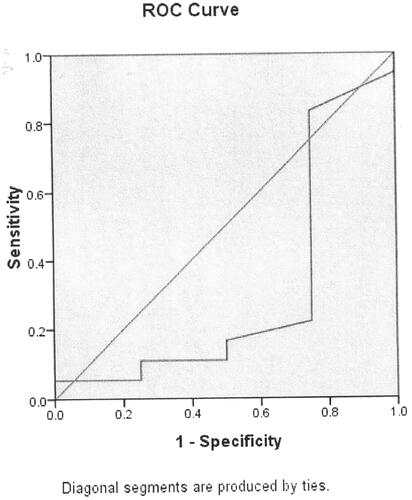
Table 4. Association between Ca level and respiratory diseases.
Data availability statement
The data will be shared by the corresponding author upon the scientific request.