
Figures & data
Figure 1. Fazekas scale of periventricular white matter hyperintensities in MRI examples.
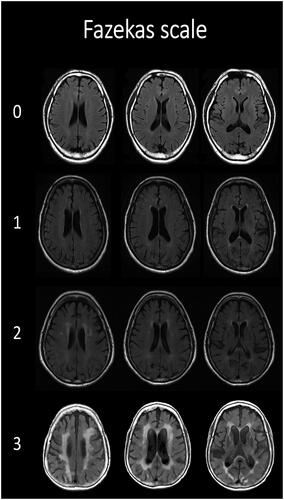
Table 1. Baseline characteristics of hemodialysis participants stratified by Fazekas scale of periventricular white matter hyperintensities and deep white matter hyperintensities.
Figure 2. The mean cognitive function test scores across the Fazekas scale of periventricular white matter hyperintensities and deep white matter hyperintensities. (A) Mini-mental State Examination (MMSE), (B) Montreal cognitive assessment (MoCA), and (C) The cognitive Abilities Screening Instrument (CASI).
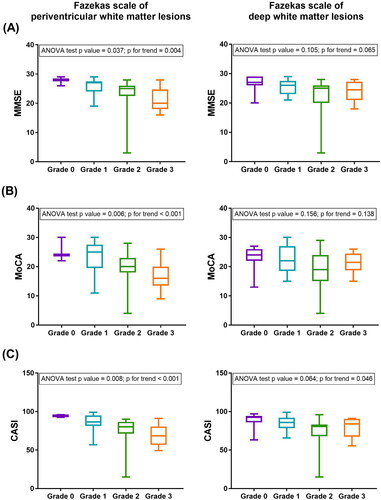
Figure 3. The mean values of the cognitive Abilities Screening Instrument (CASI) subdomains across the Fazekas scale of (A) periventricular white matter hyperintensities and (B) deep white matter hyperintensities.
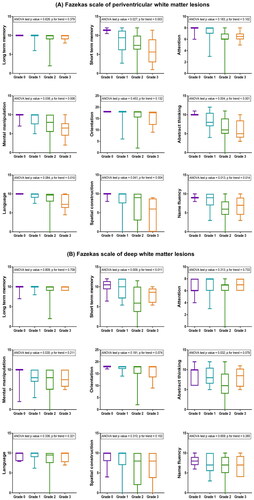
Table 2. Association between cognitive function score and Fazekas scale of periventricular white matter hyperintensities (PVWMHs) and deep white matter hyperintensities (DWMHs) in hemodialysis participants using ordinal regression analysis with confounders adjustment.
Supplemental Material
Download MS Word (635.7 KB)Data availability statement
The data will be provided upon request to the corresponding author.