
Figures & data
Table 1. Demographic and descriptive characteristics of lacrosse athletes who suffered a catastrophic incident in the US from 1 July 1982 through 30 June 2020 (n = 69).
Figure 1. Incidence rates of catastrophic injuries and events stratified by sport level in US lacrosse: college and high school from AY1982/83 to 2019/20 and youth level from AY2005/06 to 2019/20. Vertical interval bands represent 95% confidence intervals for the incidence rate per 100,000 AS. *Hit in chest injuries include both commotio cordis and cardiac contusions. **Youth incidence rates calculated from AY2005/06 to 2019/20.
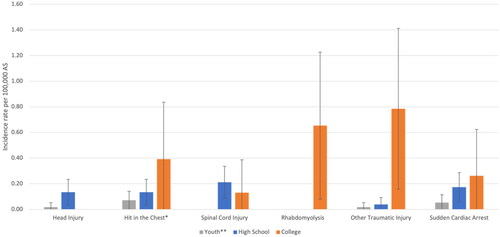
Figure 2. Frequency and incidence rate of all catastrophic events by academic year stratified by sport level: college and high school from AY1982/83 to 2019/20 and youth level and all levels combined from AY2005/06 to 2019/20. Simple linear regression model (dotted line is the line of best fit for the rate). (a) College AY1982/83–2019/20: decrease in the incidence rate is not significant (p = .6953); beta coefficient = –0.03; SE = 0.08. (b) High school AY1982/83–2019/20: decrease in the incidence rate is not significant (p = .3185); beta coefficient = –0.02; SE = 0.02. (c) Youth AY2005/06–2019/20: decrease in the incidence rate is not significant (p = .2783); beta coefficient = –0.02; SE = 0.02. (d) All levels AY2005/06-2019/20: decrease in the incidence rate is not significant (p = .0673); beta coefficient = –0.06; SE = 0.03.
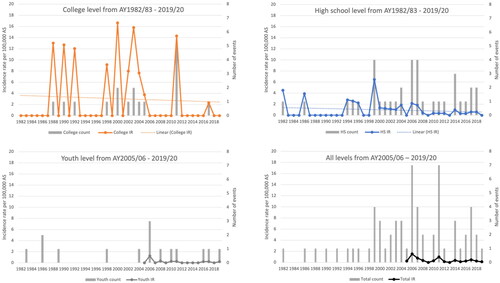
Table 2. Incident rates and associated 95% confidence intervals for catastrophic events in each sport level stratified by sex, event type and overall injury category type for all catastrophic events, fatal events and non-fatal events that occurred in lacrosse in the US from 1 July 1982 through 30 June 2020 (n = 62).
Table 3. Male cardiac fatality incidence rates and proportion survivorship comparisons before and after initiatives to improve access to AEDs from AY1982/83–2006/07 to AY2007/08–2019/20.
Supplemental Material
Download MS Word (166.3 KB)Data availability statement
Data are available upon reasonable request if approved by the responsible Institutional Review Board. Patient identifiable information cannot be shared.