
Figures & data
Figure 1. Diagram of the preferred reporting items for systematic review and meta-analysis (PRISMA).
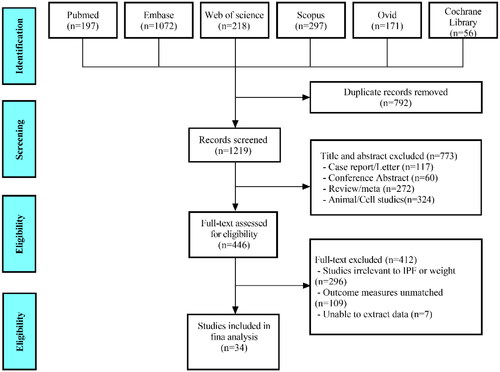
Figure 2. The forest plot pooled the hazard ratio of BMI predicting mortality in IPF.
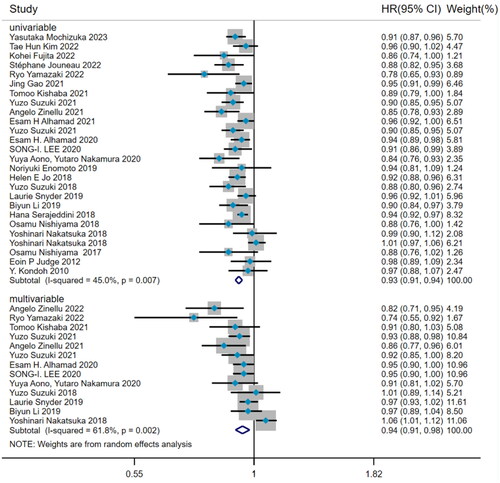
Figure 3. The forest plot pooled the hazard ratio of BMI predicting acute exacerbation in IPF.
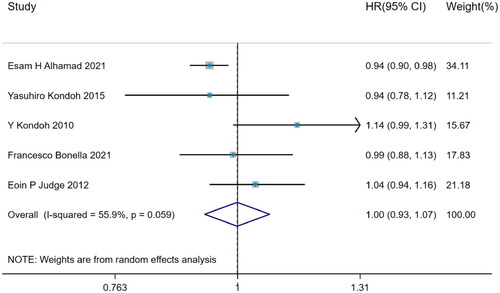
Figure 4. The forest plot pooled the hazard ratio of BMI predicting hospitalization in IPF.
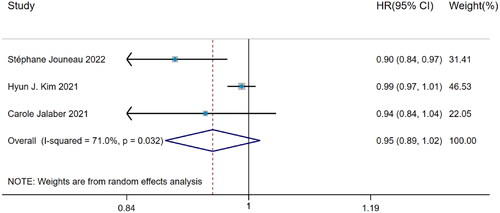
Figure 5. The forest plot pooled the odds ratio of weight loss predicting mortality in IPF.
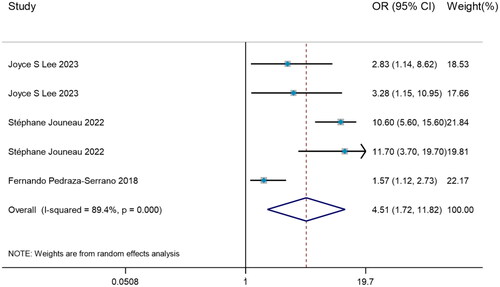
Figure 6. The forest plot pooled the hazard ratio of weight loss predicting mortality in IPF.
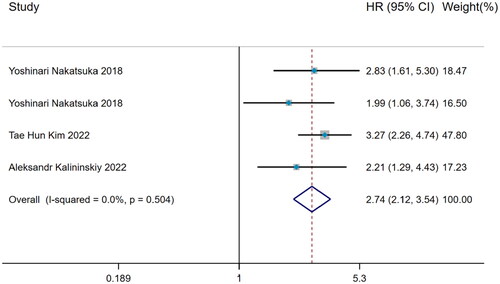
Figure 7. Funnel plots of trim-and-fill analysis (A: univariable; B: multivariable) for hazard ratio predicting mortality in IPF.
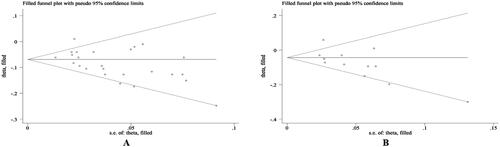
Table 1. Egger’s test for studies on BMI and weight loss predicting mortality, acute exacerbation and hospitalization in patients with IPF.
Supplemental Material
Download MS Word (564.6 KB)Data availability statement
The original data presented in the study are included in the article/Supplementary Material, further inquiries can be directed to the corresponding author.