
Figures & data
Table 1. Characteristics of included samples by breast cancer.
Table 2. Logistic risk analysis for sleep duration, depression and breast cancer.
Figure 1. Receiver operating characteristic (ROC) curve of caffeine intake, PA and prostate cancer by using four machine learning algorithms.
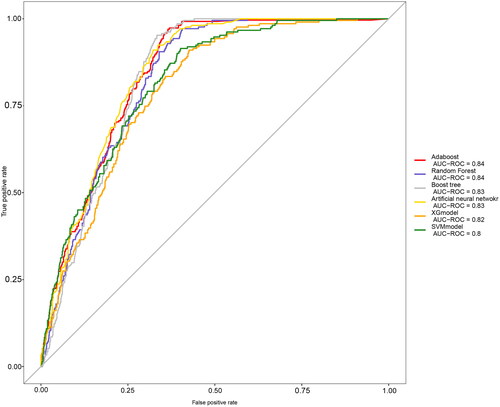
Figure 2. Calibration curve of 6 machine learning algorithms.
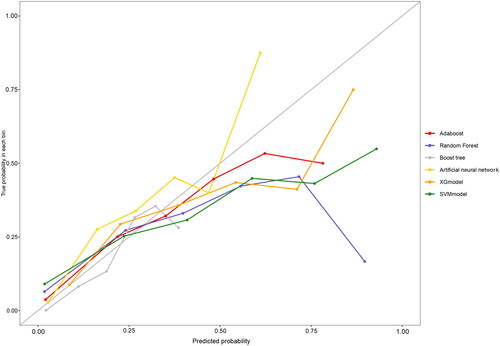
Figure 3. Comparison of accuracy and kappa value among 4 machine learning algorithms.
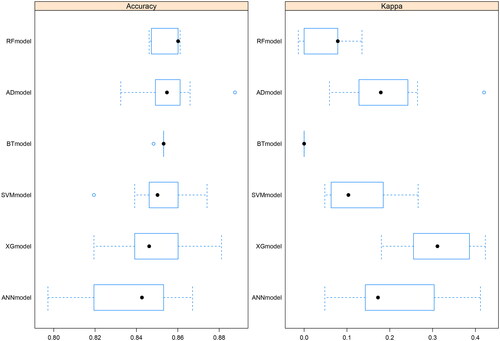
Table 3. Detailed comparison of ROC curve related indicators of six machine-learning algorithms.
Supplemental material
Supplemental Material
Download TIFF Image (3.1 MB)Data availability statement
All the data could be accessed from the website of the American Centers for Disease Control and Prevention (https://www.cdc.gov/nchs/nhanes).