
Figures & data
Figure 1. Examples of structuralization of health record in text: (A) shows the text segmentation of the text records of a real case, while (B) shows the physical complaints extracted from this record data.
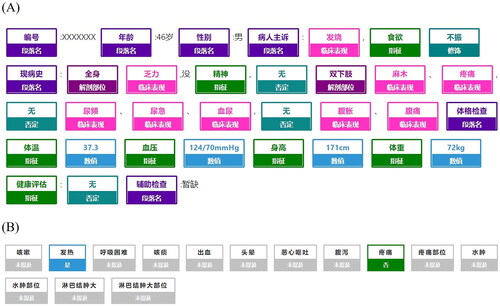
Table 1. List of the frequencies of the present symptoms (N = 158,988).
Table 2. The sensitivity and specificity of the model at different cutoff values.
Figure 2. Correlations between each pair of physical complaints in the study sample (N = 158,988). (Cells with dot indicate statistically significant correlation. Blue and red colour represent positive and negative correlation, respectively. The correlations were measured using Spearman’s rank correlation co-efficient, and the statistical significance was determined using Z-test.)
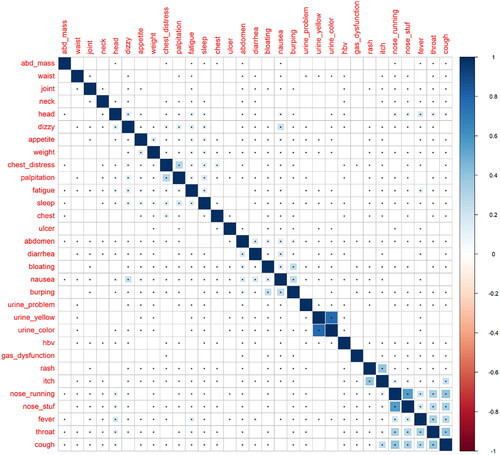
Figure 3. Patterns of physical complaints: (A) is the pattern of CHB patients; and (B) is the pattern of non-CHB people (symptoms in the same cluster usually present at the same time, and vice versa).
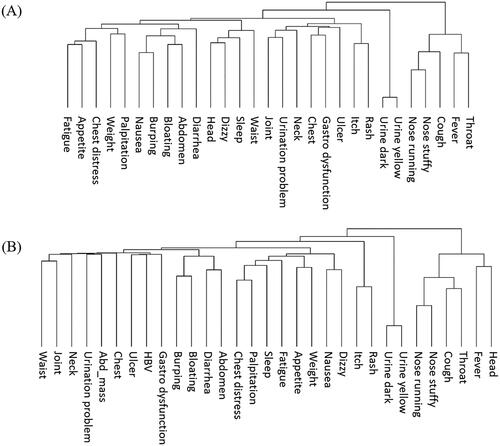
Figure 4. ROC curves of different HBV detection models on test sample (n = 9,131).
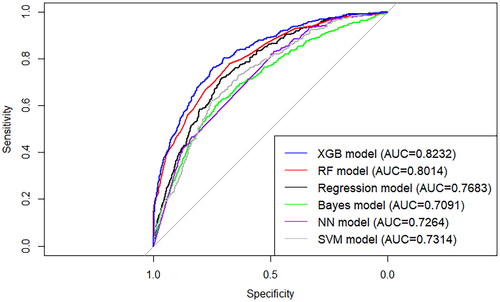
Figure 5. Importance of the predictors in XGB model based on physical complaints and clinical parameters (X-axis is the SHAP value of different predictors. Predictors with higher SHAP value can provide more predictive power and are more important).
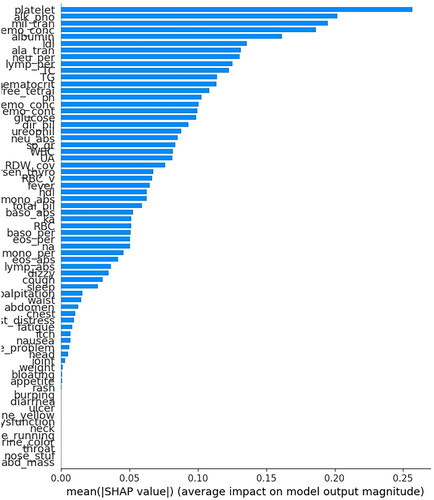
Figure 6. Nonlinear effects of the top ten important predictors in the XGB model based on symptoms and clinical parameters.
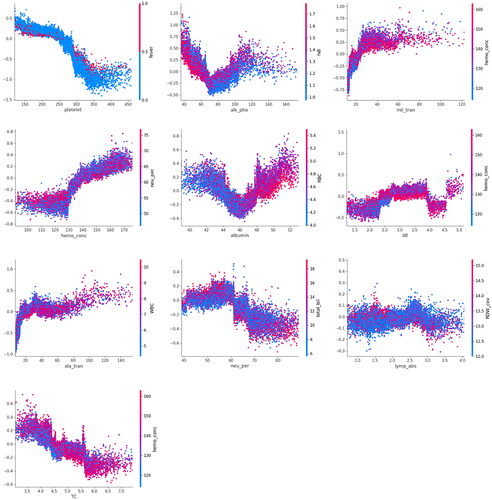
Figure 7. ROC curves of different HBV detection models based on symptoms and common clinical parameters on test sample (n = 9,131).
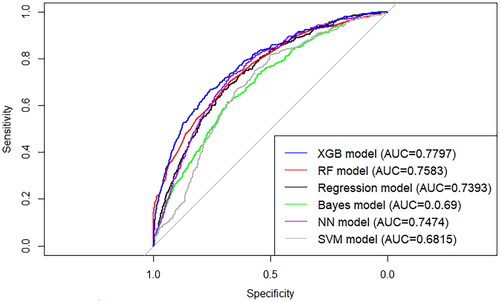
Figure 8. Importance ranking of the predictors in XGB model based on symptoms and common clinical parameters.
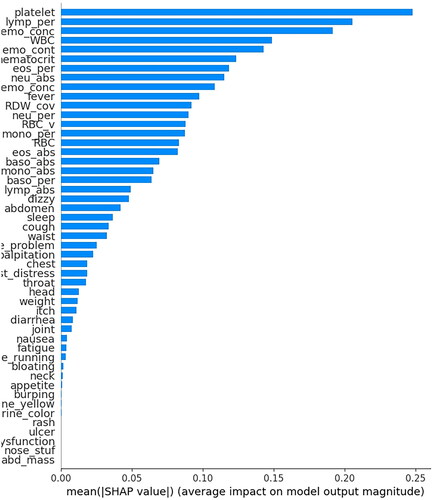
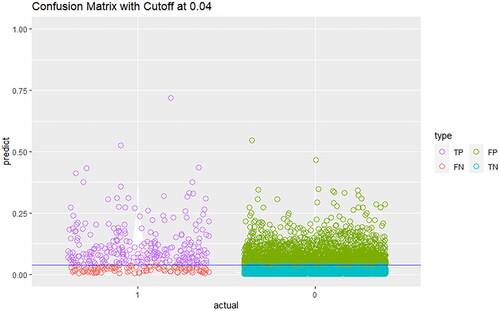
Figure 9. Confusion matrix of the risk XGB model based on physical complaints and clinical parameters at cutoff of HBV prevalence in cohort. (TP = true positive; FP = false positive; FN = false negative; TN = true negative).
Supplemental Material
Download Zip (8.3 MB)Supplemental Material
Download Zip (3.5 MB)Data availability statement
Data of this study are available from the corresponding author upon reasonable request.