
Figures & data
Figure 1. Stages 1 – 4 of iERM. En-face images (upper row). B-scan images (lower row) (A) Stage 1, FAZ area 0.23 mm2 (upper), CMT 296 μm (lower). (B) Stage 2, FAZ area 0.12 mm2 (upper), CMT 386 μm (lower). (C) Stage 3, FAZ area 0.06 mm2 (upper), CMT 572 μm (lower). (D) Stage 4, FAZ area 0.02 mm2 (upper), CMT 715 μm (lower). iERM: idiopathic macular epiretinal membrane; CMT: central macular thickness. (All OCTA scans were acquired in a 3x3mm setting.).
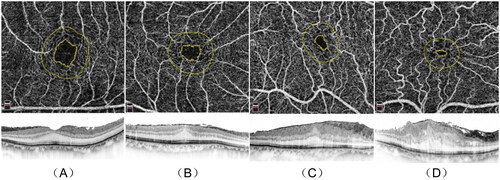
Table 1. Baseline measurements with FAZ area classification.
Figure 2. LogMAR BCVA in pre- and postoperative iERM eyes with surgery.
The significant differences in pairwise comparison were signed by “*”: * p < 0.05; ** p < 0.01; *** p < 0.001. BCVA: best-corrected visual acuity; logMAR: log (minimum angle of resolution); Pre-op: pre-operation; 1 month post-op: 1 month post-operation; 3 months post-op: 3 months post-operation; 6 months post-op: 6 months post-operation; 1 yearar post-op: 1 year post-operation.
Independent sample t-tests were used in all statistical analyses.
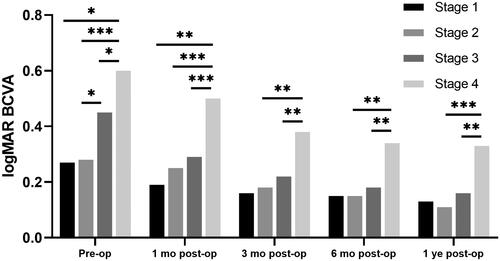
Table 2. LogMAR BCVA in pre- and postoperative iERM eyes with surgery.
Figure 3. CMT in pre- and postoperative iERM eyes with surgery.
The significant differences in pairwise comparison were signed by “*”: * p < 0.05; ** p < 0.01; *** p < 0.001. CMT: central macular thickness; Pre-op: pre-operation; 1 month post-op: 1 month post-operation; 3 months post-op: 3 months post-operation; 6 months post-op: 6 months post-operation; 1 year post-op: 1 year post-operation.
Independent sample t-tests were used in all statistical analyses.
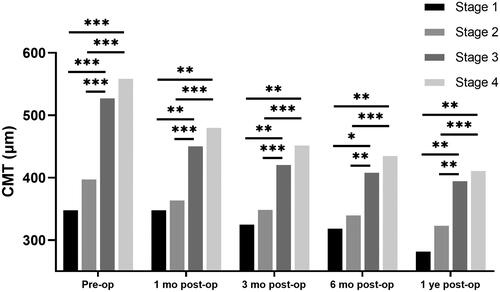
Table 3. CMT (μm) in pre- and postoperative iERM eyes with surgery.
Table 4. Correlation analysis of preoperative logMAR BCVA.
Table 5. Correlation analysis of 1-year follow-up logMAR BCVA in eyes with surgery.
Data availability statement
The data supporting this study’s findings are available on reasonable request from the corresponding author, Shen L. However, the data are not publicly available because they contain information that could compromise the privacy of the research participants.