
Figures & data
Figure 1. Study cohort.
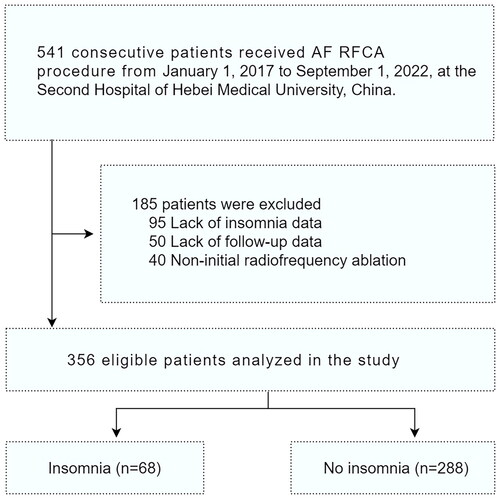
Table 1. Baseline characteristics of the included participants.
Figure 2. Kaplan–Meier plot estimates of the rate of recurrence of atrial fibrillation according to insomnia group. A. Event rates of recurrence of atrial fibrillation in the insomnia and noninsomnia groups; B. Landmark analysis discriminating between events occurring prior to and subsequent to the one-year follow-up period.
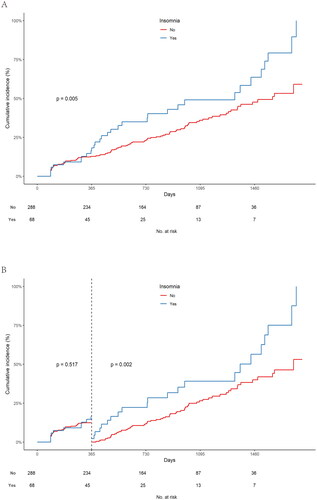
Table 2. Associations between insomnia and recurrence after radiofrequency catheter ablation for atrial fibrillation in the crude, multivariate and PS analyses.
Table 3. Dose–response relationship between insomnia symptoms and events of atrial fibrillation recurrence.
Figure 3. Forest plot of subgroup analysis.
PVI Plus, cavotricuspid isthmus, superior vena cava, arrhythmogenic substrate modification or LA linear ablation beyond PVI.
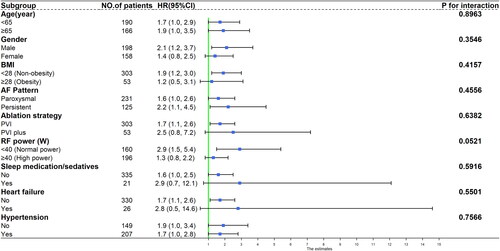
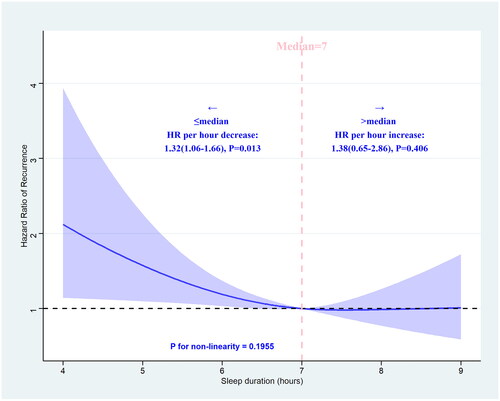
Figure 4. Association between sleep duration and recurrence of atrial fibrillation after radiofrequency catheter ablation using a restricted cubic spline regression model.
The adjustment strategy is the same as Model 3 in . P value for the association between sleep duration and recurrence of AF based on restricted cubic spline regression model = 0.0444 (chi-square= 6.23, df = 2). The blue ribbon represents the 95% CI for the spline model. Reference lines for no association are indicated by the dashed black lines at an HR of 1.0.
Supplemental Material
Download MS Word (578.8 KB)Availability of data and materials
The relevant raw data of this article will be made available upon request by the authors.