
Figures & data
Figure 1. Incidence of cirrhosis in 204 countries and regions worldwide burden of disease: A. ASR for the incidence of cirrhosis in 2019; B. Changes in the cases of cirrhosis from 1990 to 2019; C. EAPC analysis of cirrhosis ASR from 1990 to 2019. ASIR, age-standardized rate; EAPC, estimated annual percent change. Source: Institute for Health Metrics and Evaluation. Used with permission. All rights reserved.
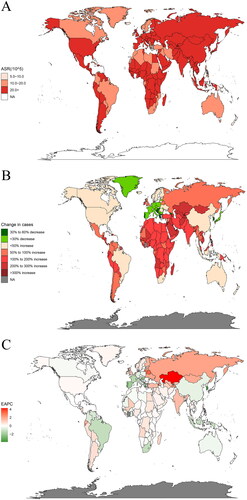
Table 1. ASIR, change in case numbers and EAPC for cirrhosis in different countries.
Table 2. Incidence rate and age–standardized incidence of cirrhosis in various countries of the world from 1990 to 2019 and temporal trends from 1990 to 2019.
Figure 2. Disease burden of cirrhosis mortality in 204 countries and territories worldwide: A. ASR for cirrhosis mortality in 2019; B. Changes in the cases of cirrhosis from 1990 to 2019; C. EAPC analysis of cirrhosis ASR from 1990 to 2019. ASR, age-standardized rate; EAPC, estimated annual percent change. Source: Institute for Health Metrics and Evaluation. Used with permission. All rights reserved.
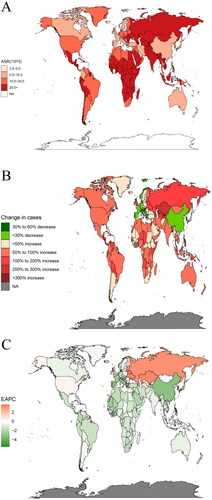
Table 3. ASDR, change in case numbers and EAPC for cirrhosis in different countries.
Table 4. Number of liver cirrhosis mortalities, death rate and ASDR by gender in 2019.
Figure 3. Cluster analysis: Estimated annual percent change data combining incidence and deaths. Source: Institute for Health Metrics and Evaluation. Used with permission. All rights reserved.
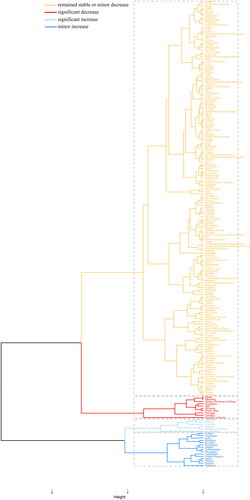
Figure 4. Contribution of hepatitis B, hepatitis C, NAFLD, alcohol use, and other causes to cirrhosis cases (in both genders), globally and regionally, in 1990 and 2019: A. The proportion of cirrhosis caused by various causes in 1990; B. The proportion of cirrhosis caused by various causes in 2019. NAFLD, Non-alcoholic fatty liver disease. Source: Institute for Health Metrics and Evaluation. Used with permission. All rights reserved.
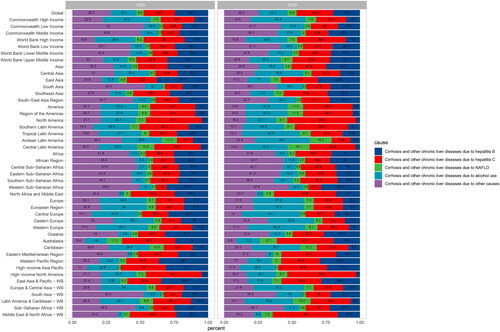
Figure 5. Summary exposure value changes of alcohol and drug use in 46 GBD regions from 1990 to 2019: A. Changes in SEV for alcohol use; B. Changes in SEV for alcohol use. Source: Institute for Health Metrics and Evaluation. Used with permission. All rights reserved.
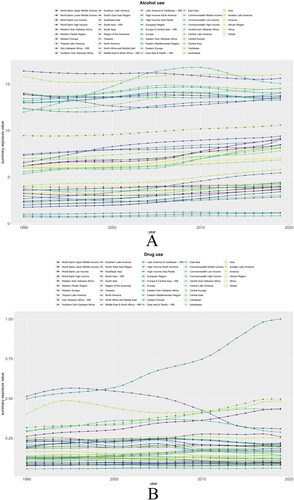
Figure 6. Proportion of DALYs and deaths from cirrhosis due to alcohol use and drug use in 46 GBD regions in 2019: A. Proportion of DALYs and death in cirrhosis due to alcohol use; B. Proportion of DALYs and death in cirrhosis due to drug use. DALYs, Disability Adjusted Life Year; GBD, Global Burden of Disease, Injury, and Risk Factors Study. Source: Institute for Health Metrics and Evaluation. Used with permission. All rights reserved.
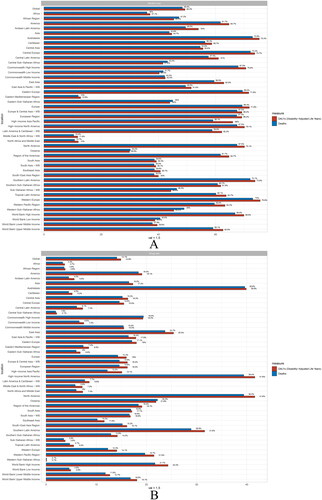
Figure 7. Correlation of EAPC with cirrhosis ASR and HDI: A. Correlation of EAPC with cirrhosis ASIR and ASDR in 1990. B. Correlation of EAPC with 2019 cirrhosis ASIR and ASDR. C. Correlation of EAPC with 2019 HDI. The circles in the figure represent countries, and the size of the circles represents the number of cases of cirrhosis. ρ and P values were obtained from Pearson correlation coefficient analysis. ASR, age–standardized rate; ASIR, age–standardized Incidence rate; ASDR, age–standardized death rate; EAPC, estimated annual percentage change; HDI, human development index. Source: Institute for Health Metrics and Evaluation. Used with permission. All rights reserved.
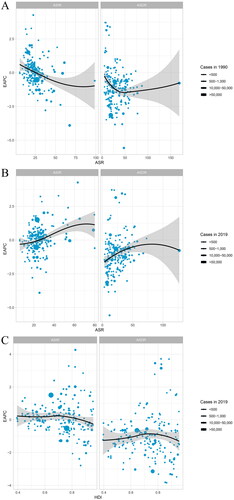
Figure 8. ASR trends in cirrhosis by socio–demographic index, 1990–2019: A. 21 GBD regions; B. 204 countries and territories. Expected values for sociodemographic indices and disease incidence based on all sites are shown as black lines. ASR, age–standardized rate; GBD, Global Burden of Diseases, Injuries, and Risk Factors Study. Source: Institute for Health Metrics and Evaluation. Used with permission. All rights reserved.
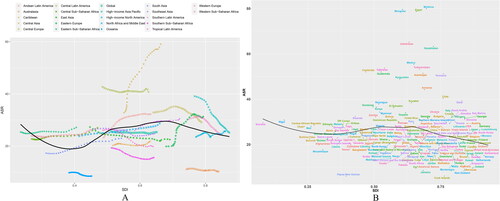
Figure 9. Statistics and predictions of the number of cases in all age groups: A. Prediction based on Nordpred model; B. Prediction based on BAPC model. Source: Institute for Health Metrics and Evaluation. Used with permission. All rights reserved.
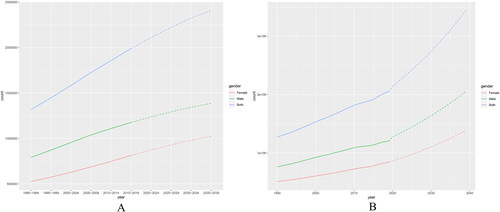
Figure 10. Cirrhosis incidence 1990–2019 and projections for the next 20 years, stratified by gender: A. Number of female cases; B. Female incidence rate; C. Number of male cases; D. Male incidence rate. Prediction of changes over the next 20 years based on the Nordpred model. Source: Institute for Health Metrics and Evaluation. Used with permission. All rights reserved.
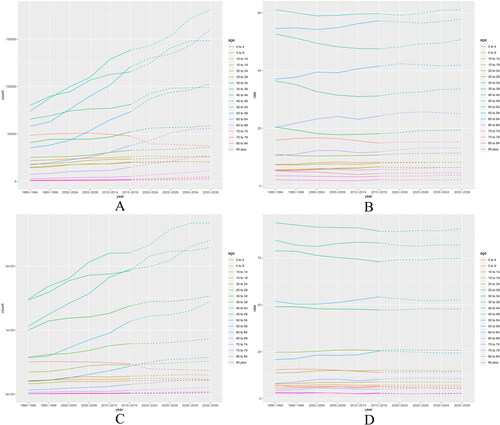
Figure 11. Cirrhosis incidence 1990–2019 and projections for the next 20 years, stratified by gender: A. Number of female cases; B. Female incidence rate; C. Number of male cases; D. Male incidence rate. Prediction of changes over the next 20 years based on the BAPC model. Source: Institute for Health Metrics and Evaluation. Used with permission. All rights reserved.
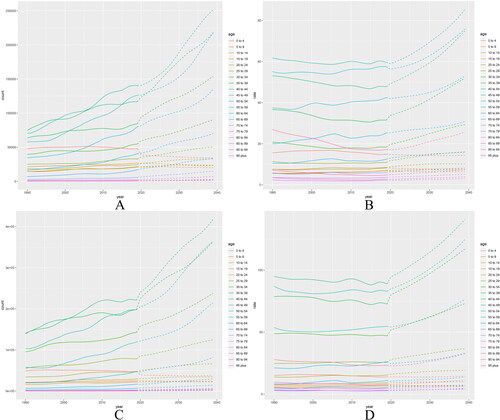
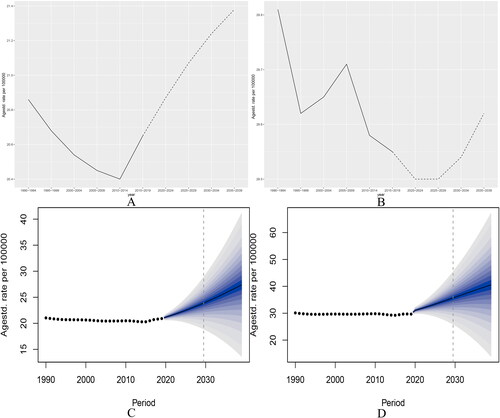
Figure 12. Statistics and predictions of cirrhosis ASR for different genders: A and B are based on the Nordpred model for females and males, respectively; C and D are based on the BAPC model, respectively. ASR, age–standardized rate. Source: Institute for Health Metrics and Evaluation. Used with permission. All rights reserved.
Supplemental Material
Download Zip (269.6 KB)Data availability statement
The data were obtained through an online query tool from the website of IHME (http://ghdx.healthdata.org/), and no permissions were required to access the data.