
Figures & data
Table 1. Demographic characteristics in all patients.
Table 2. Payment sources and discharge plan in total patients.
Table 3. Difference between discharge plan and characteristics in total patients.
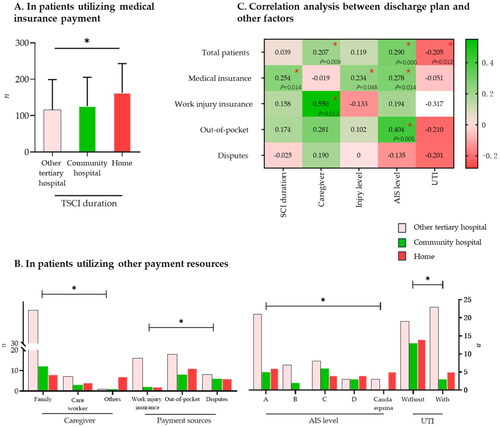
Figure 1. The items showed significant difference in different payment resources according to discharge plan and the correlation analysis between discharge plan and other factors. (A) The items showed significant difference in between-group analysis in patient utilizing medical insurance payment; (B) the items showed significant difference in between-group analysis in patient utilizing other payment resources; (C) correlation analysis between discharge plan and significant factors; TSCI: spinal cord injury; AIS: American Spinal Injury Association Impairment Scale; UTI: urinary tract infection (only the items that showed significant difference between groups according to the discharge plan are shown in A and B).
Data availability statement
The datasets used and/or analyzed for the development of this manuscript are available from the corresponding author upon reasonable request.