
Figures & data
Figure 1. PRISMA diagram of literature search and study inclusion.
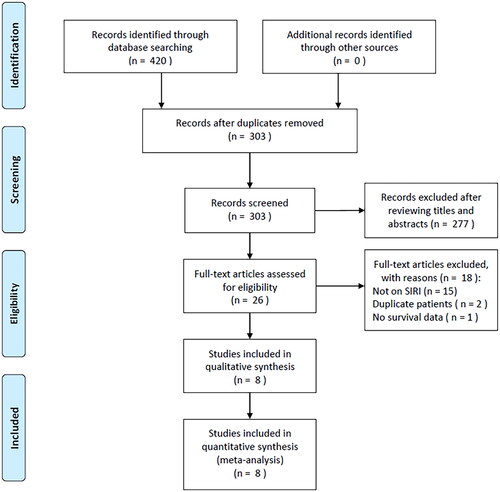
Table 1. The basic characteristics of included studies.
Figure 2. Forest plot of meta-analysis of the relationship between SIRI and OS in patients with BC.
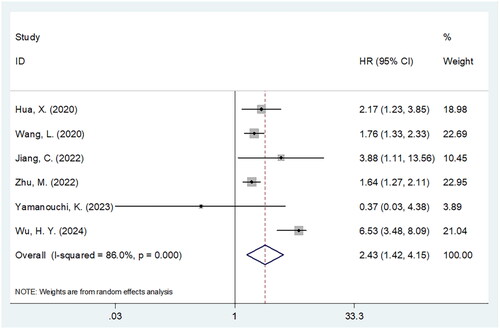
Table 2. Subgroup analysis of the prognostic value of SIRI for OS in patients with breast cancer.
Figure 3. Forest plot of meta-analysis of the relationship between SIRI and DFS in patients with BC.
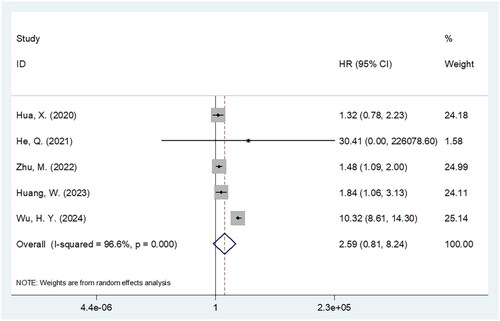
Table 3. Subgroup analysis of the prognostic value of SIRI for DFS in patients with breast cancer.
Figure 4. Forest plots of the correlations between SIRI and clinicopathological features in BC. (A) Age (year) (≥50 vs <50); (B) T stage (T3–T4 vs T1–T2); (C) N stage (N1–N3 vs N0); and (D) TNM stage (III vs I-II).
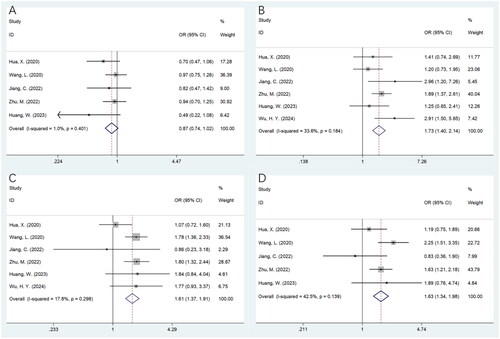
Figure 5. Forest plots of the correlations between SIRI and clinicopathological features in BC. (A) ER status (positive vs negative); (B) PR status (positive vs negative); (C) HER2 status (positive vs negative); and (D) Differentiation (poor vs well/moderate).
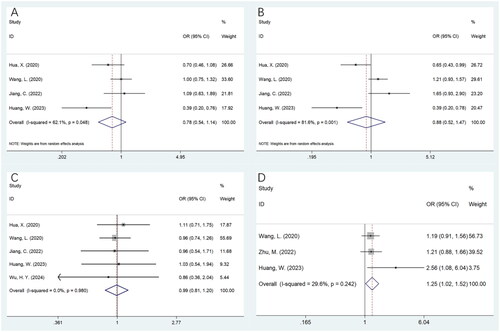
Table 4. The association between SIRI and clinicopathological features in patients with breast cancer.
Figure 6. Sensitivity analyses of outcomes. (A) OS. (B) DFS.
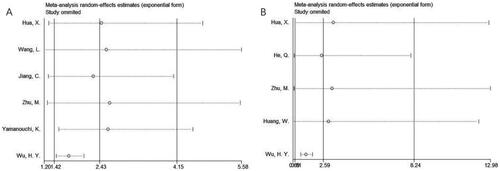
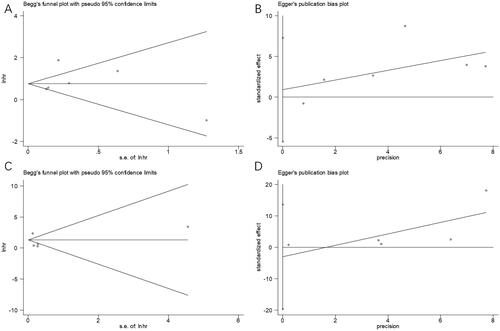
Figure 7. Publication bias tested by Begg’s test and Egger’s test. (A) Begg’s test for OS, p = 0.452; (B) Egger’s test for OS, p = 0.709; (C) Begg’s test for DFS, p = 0.806; and (D) Egger’s test for DFS, p = 0.606.
Supplemental Material
Download Zip (30.1 KB)Availability of data and materials
The data that support the findings of this study are available from the corresponding author upon reasonable request.