Figures & data
Table 1. Baseline characteristics of 125 matched participants with different OSA severity levels.
Table 2. Associations between T266M and clinical characteristics of OSA participants.
Figure 1. Visualization of the docked complex between human ANGPTL4 and ACACA. A: a) Interaction docking structure between wild-type ANGPTL4 and ACACA. b) Surface area visualization showing the compact fitting of ACACA. c) Surface area visualization showing the compact fitting of wild-type ANGPTL4. B: a) Interaction docking structure between mutant ANGPTL4 T266M and ACACA. b) Surface area visualization showing the compact fitting of ACACA. c) Surface area visualization showing the compact fitting of mutant ANGPTL4 T266M. C: Intra-chain interaction of wild-type ANGPTL4. D: Intra-chain interaction of mutant ANGPTL4 T266M.
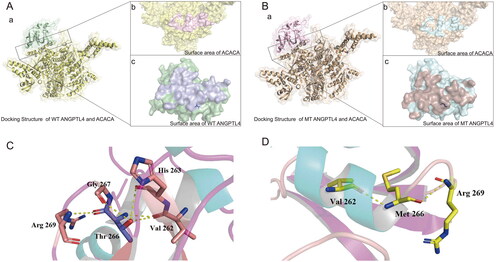
Table 3. Interactions between residues located on the contact surfaces of ANGPTL4, T266M, and ACACA.
Figure 2. Interpretation of the stability of wild-type (WT) and mutated ANGPTL4. A: Comparison of root mean square deviation (RMSD) for WT and mutated ANGPTL4 proteins. B: Comparison of root mean square fluctuation (RMSF) for residues of WT and mutated ANGPTL4.
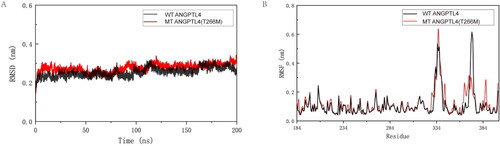
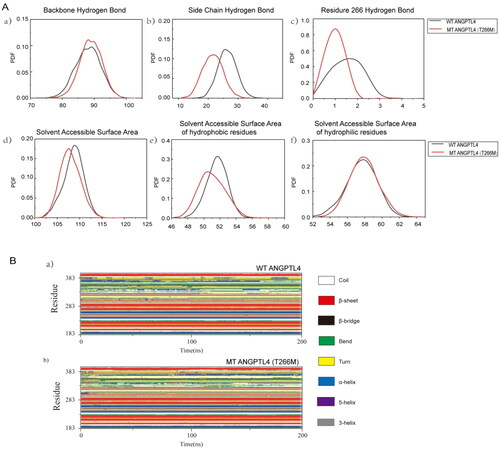
Figure 3. Comparison of the structures of WT and mutated ANGPTL4. A: Probability density function (PDF) map comparing WT and mutated ANGPTL4 in a) backbone hydrogen bonds; b) side chain hydrogen bonds; c) hydrogen bonds at residue 266; d) solvent-accessible surface area; e) solvent-accessible surface area of hydrophobic residues; f) solvent-accessible surface area of hydrophilic residues. B: a) Secondary structure of WT ANGPTL4 protein; b) Secondary structure of mutant (MT) ANGPTL4 protein.