
Figures & data
Table 1. Study participant characteristics.
Table 2. Extraintestinal manifestations.
Figure 1. Blood monocyte concentration is higher in IBD patients with EIMs. (A) Monocyte concentration (×109/L) between IBD-EIM and IBD-C. Values above the redline are above reference levels and represents monocytosis (>0.70 × 10⁹/L). (B) Monocyte concentration by EIM count (0, 1, ≥2). (C) Monocyte concentration between CD-EIM and CD-C. (D) Monocyte concentration between UC-EIM and UC-C. (E) Monocytosis in IBD-EIM vs. IBD-C. (F) Monocytosis by EIM count. (G) Monocytosis between CD-EIM and CD-C. (H) Monocytosis between UC-EIM and UC-C. MW: Mann–Whitney’s test; KW: Kruskal–Wallis test; FE: Fisher’s exact test. Monocytes were not available for all participants, leading to reduced group sizes for this analysis: IBD-EIM (n = 85), IBD-C (n = 40), CD-EIM (n = 59), CD-C (n = 18), UC-EIM (n = 26) and UC-C (n = 22). p Values < .05 were considered significant.
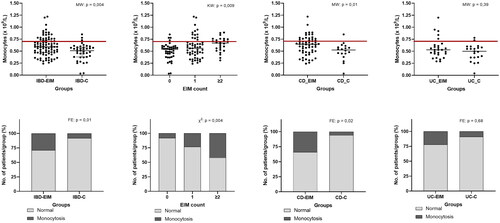
Figure 2. Fecal microbiota amplicon sequence variants (ASVs) differ between inflammatory bowel diseases patients with (IBD-EIM) or without (IBD-C) extraintestinal manifestations (EIM). (A) Alpha-diversity indices between IBD-EIM (red) and IBD-C (blue) (Pielou’s evenness, p = .01, Shannon’s diversity, p = .02). (B) Principal coordinate analysis plot depicts beta-diversity distance matrices between IBD-EIM (red) and IBD-C (blue) patients (weighted UniFrac, PERMANOVA; R2 = 0.02, p = .01). (C) Volcano plot of significant ASVs between IBD-EIM and IBD-C. Significant ASVs (p.fdr < .05, LogFC > 1) are coloured by genus or the highest taxonomic level identified. Significantly enriched ASVs in IBD-EIM (n = 5) are depicted on the right axis and ASVs depleted in IBD-EIM (n = 19) are depicted on the left axis.
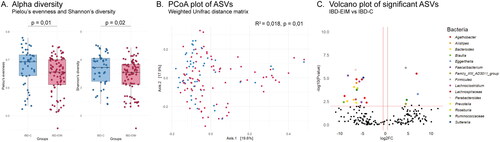
Table 3. Significant ASVs between IBD-EIM and IBD-C.
Figure 3. Fecal microbiota bacterial networks differ between IBD-EIM and IBD-C. Twenty-seven bacterial networks were identified using sparse correlations for compositional data (SparCC) on amplicon sequence variants (ASVs) with a correlation cutoff of 0.5. Three bacterial networks (module 7 (n = 16), module 8 (n = 6) and module 23 (n = 2)) were significantly different between IBD-EIM and IBD-C (logistic regression, p < .05), and all were negatively correlated with IBD-EIM. Significant modules are marked in dark red, and non-significant modules are marked in grey.
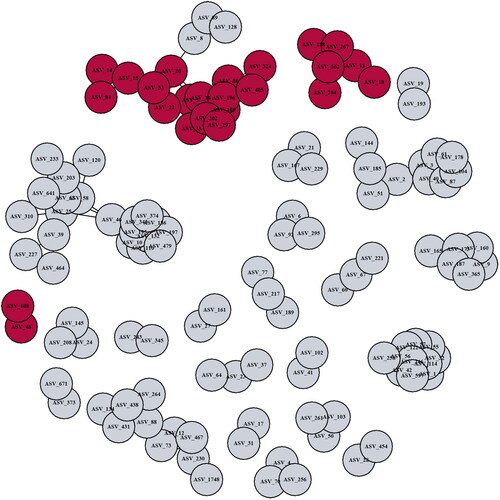
Table 4. Significant bacterial network modules with correlation ≥0.5.
Supplemental Material
Download MS Word (50.4 KB)Data availability statement
The data supporting the findings of this study are available from the corresponding author [S.H.] upon reasonable request.