
Figures & data
Table 1. Demographic and clinical characteristics in RA patients.
Table 2. Correlations of haematological makers with ultrasound parameters and DAS-28 scores.
Table 3. Results of ordinal logistic regression analysis of haematological makers with GS grades.
Table 4. Results of ordinal logistic regression analysis of haematological makers with PD grades.
Figure 1. Receiver operating characteristic (ROC) curve of PLR to predict moderate to severe synovitis.
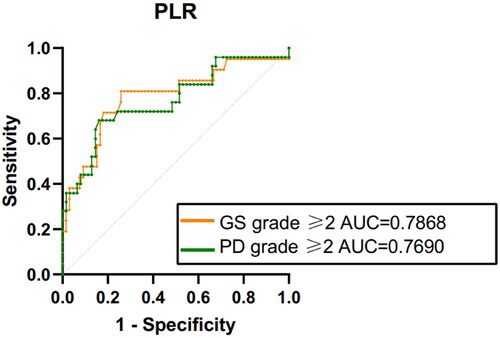
Table 5. Clinical characteristics of RA patients in different groups.
Data availability statement
The authors confirm that data supporting the findings of this study are available within the article.