
Figures & data
Figure 1. Patient flow chart.
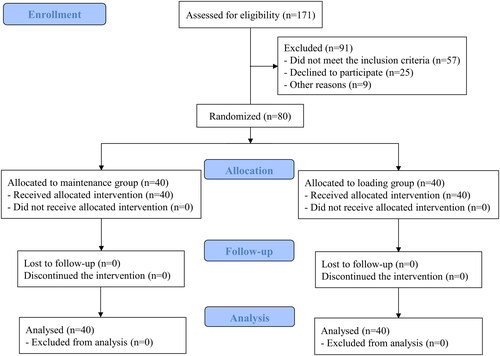
Table 1. Demographic data of the study cohort.
Figure 2. Forest plot of the odds ratios for hypotension before surgical incision.
BP: blood pressure; PVi: pleth variability index.
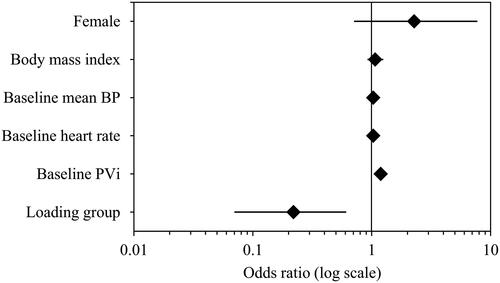
Figure 3. Receiver operating characteristic curve analysis of pleth variability index according to hypotension before surgical incision.
PVi: pleth variability index; AUC: area under curve; Sens: sensitivity; Spec: specificity; PPV: positive predictive value; NPV: negative predictive value.
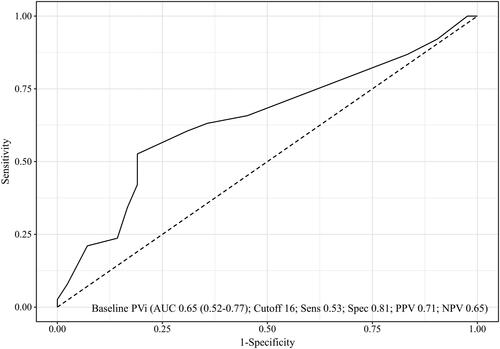
Table 2. Perioperative data of the study cohort.
Table 3. Univariable and multivariable logistic regression analysis of factors associated with hypotension before surgical incision.
Figure 4. Mean blood pressure and heart rate before surgical incision.
M: maintenance; L: loading; ANS: anaesthesia. *Significant differences.
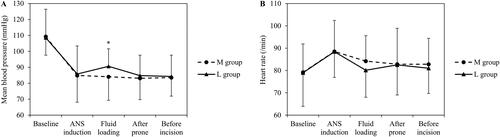
Figure 5. Pleth variability index, stroke volume variation and pulse pressure variation before surgical incision.
M: maintenance; L: loading; ANS: anaesthesia. *Significant differences.
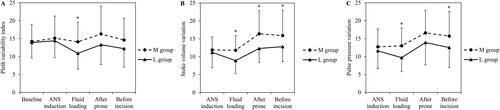
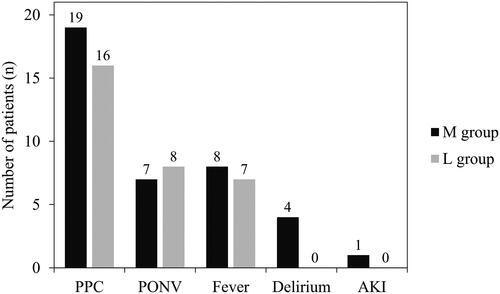
Figure 6. Postoperative complications.
M: maintenance; L: loading; PPC: postoperative pulmonary complications; PONV: postoperative nausea and vomiting; AKI: acute kidney injury.
Supplemental Material
Download Zip (63.2 KB)Data availability statement
The datasets used and analysed in the current study are available from the corresponding author upon reasonable request. The data are not publicly available because of privacy and ethical restrictions.