
Figures & data
Table 1. Baseline characteristics of male subjects.
Figure 1. Correlations between sleep data and serum biomarkers in mild OSA. Spearman’s rank correlation coefficients were calculated to determine the influence of PSG variables on the levels of serum biomarkers in mild OSA (n = 59). The r values are represented by gradient colors, with red cells indicating positive correlations and the blue cells indicating negative correlations. *p < .05; **p < .01. AHI: apnea-hypopnea index; MSpO2: mean pulse oxygen saturation; LSpO2: lowest pulse oxygen saturation; ODI: oxygen desaturation index; MAI: micro-arousal index; ESS: Epworth sleepiness scale; MT: melatonin; ZO-1: zonula occludens-1; LPS: lipopolysaccharide; CRP: C-reactive protein; PSG: polysomnography.
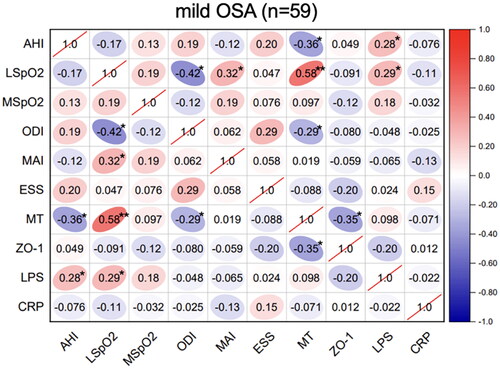
Figure 2. Correlations between sleep data and serum biomarkers in moderate OSA. Spearman’s rank correlation coefficients were calculated to determine the influence of PSG variables on the levels of serum biomarkers in moderate OSA (n = 55). The r values are represented by gradient colors, with red cells indicating positive correlations and the blue cells indicating negative correlations. *P < .05; **P < .01. Abbreviations: AHI: apnea-hypopnea index, MSpO2: mean pulse oxygen saturation, LSpO2: lowest pulse oxygen saturation, ODI: oxygen desaturation index, MAI: micro-arousal index, ESS: Epworth sleepiness scale, MT: melatonin, ZO-1: zonula occludens-1, LPS: lipopolysaccharide, CRP: C-reactive protein, PSG: polysomnography.
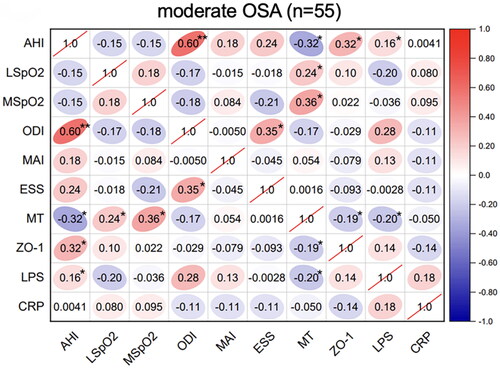
Figure 3. Correlations between sleep data and serum biomarkers in severe OSA. Spearman’s rank correlation coefficients were calculated to determine the influence of PSG variables on the levels of serum biomarkers in severe OSA (n = 61). The r values are represented by gradient colors, with red cells indicating positive correlations and the blue cells indicating negative correlations. *P < .05; **P < .01. Abbreviations: AHI: apnea-hypopnea index, MSpO2: mean pulse oxygen saturation, LSpO2: lowest pulse oxygen saturation, ODI: oxygen desaturation index, MAI: micro-arousal index, ESS: Epworth sleepiness scale, MT: melatonin, ZO-1: zonula occludens-1, LPS: lipopolysaccharide, CRP: C-reactive protein, PSG: polysomnography.
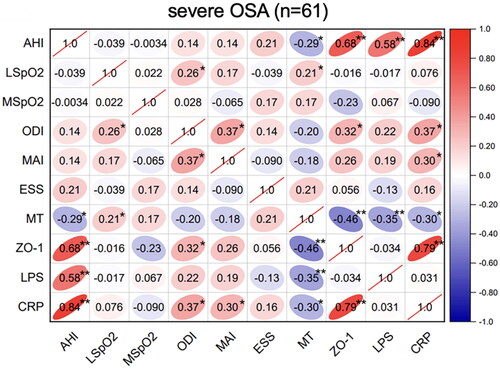
Figure 4. Path diagram showing how melatonin mediated the effect of AHI on intestinal barrier dysfunction and systemic inflammation in moderate-severe OSA patients. (A)shows melatonin mediates association between AHI and ZO-1; (B)shows melatonin mediates association between AHI and LPS. *means P< .05. B: the unstandardized coefficient. AHI: apnea-hypopnea index; ZO-1: zonula occludens-1, LPS: lipopolysaccharide.
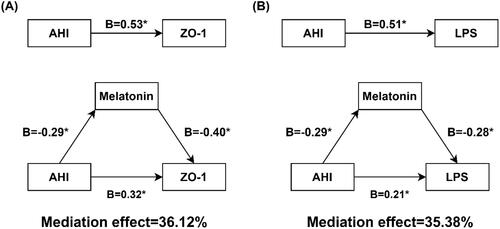
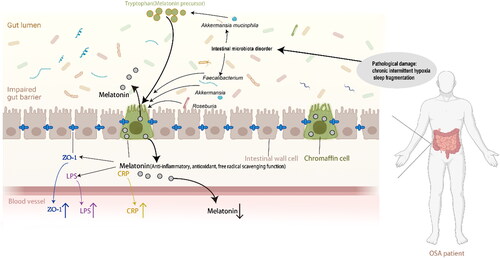
Figure 5. Schematic representation of the relationship between melatonin and intestinal barrier damage (biomarker: ZO-1) and systemic inflammation (biomarker: LPS, CRP). This figure was created using BioRender.com and further edited with Adobe Photoshop 2023 and Adobe Illustrator 2021. ZO-1: zonula occludens-1, LPS: lipopolysaccharide, CRP: C-reactive protein.
Supplemental Material
Download MS Word (41.4 KB)Data availability statement
The data that support the findings of this study are available from the corresponding author, [JG], upon reasonable request.